Doing Business 2017

The World Bank’s latest Doing Business report has been released. The report “measures regulations affecting 11 areas of the life of a business. Ten of these areas are included in this year’s ranking on the ease of doing business: starting a business, dealing with construction permits, getting electricity, registering property, getting credit, protecting minority investors, paying taxes, trading across borders, enforcing contracts and resolving insolvency. Doing Business also measures labor market regulation, which is not included in this year’s ranking.”

Its key findings are as follows:

  • Doing Business 2017: Equal Opportunity for All finds that entrepreneurs in 137 economies saw improvements in their local regulatory framework last year. Between June 2015 and June 2016, the report, which measures 190 economies worldwide, documented 283 business reforms. Reforms reducing the complexity and cost of regulatory processes in the area of starting a business were the most common in 2015/16, as in the previous year. The next most common reforms were in the areas of paying taxes, getting credit and trading across borders. Read about business reforms.
  • Brunei Darussalam, Kazakhstan, Kenya, Belarus, Indonesia, Serbia, Georgia, Pakistan, the United Arab Emirates, and Bahrain were the most improved economies in 2015/16 in areas tracked by Doing Business. Together, these 10 top improvers implemented 48 regulatory reforms making it easier to do business.
  • Economies in all regions are implementing reforms easing the process of doing business, but Europe and Central Asia continues to be the region with the highest share of economies implementing at least one reform—96% of economies in the region have implemented at least one business regulatory reform.
  • Doing Business includes a gender dimension in four of the 11 topics sets. Starting a business, registering property and enforcing contracts present a gender dimension for the first time this year. Labor market regulation already captured gender disaggregated data in last year’s report.
  • This year’s report expands the paying taxes topic set to cover postfiling processes—what happens after a firm pays taxes—such as tax refunds, tax audits and administrative tax appeals.
  • This year’s report also includes an annex with analysis on a pilot indicator on public procurement regulations.
  • The report features six case studies in the areas of getting electricity, getting credit: legal rights, getting credit: credit information, protecting minority investors, paying taxes and trading across borders as well as two annexes in the areas of labor market regulation and selling to the government. The case studies and annexes either present new indicators or provide further insights from the data collected through methodology changes implemented in the past two years. See all case studies.

A number of things jumped out at me. First off, the rankings of the oft-praised Nordic countries, particularly Denmark and Sweden. See how those two countries compare to the U.S. below.

World Bank Rankings Denmark Sweden U.S.
Overall 3 9 8
Starting a business 24 15 51
Construction permits 6 25 39
Getting electricity 14 6 36
Registering property 12 10 36
Getting credit 32 75 2
Protecting minority investors 19 19 41
Paying taxes 7 28 36
Trading across borders 1 18 35
Enforcing contracts 24 22 20
Resolving insolvency 8 19 5

Denmark ranks higher than the United States with Sweden only a spot behind.[ref]Full rankings found on pgs. 203 (Denmark), 242 (Sweden), and 248 (United States) of the full report.[/ref] Yet, in both Denmark and Sweden it is easier to

  • Start a business
  • Get a construction permit
  • Get electricity
  • Register property
  • Protect minority investors
  • Pay taxes
  • Trade across borders

As Will Wilkinson put it, “[Y]ou cannot finance a Danish-style welfare state without free markets and large tax increases on the middle class. If you want Danish levels of social spending, you need Danish middle-class tax rates and a relatively unfettered capitalist economy.”

However, the next few graphs are probably some of the most interesting bits of the report:

As the report explains,

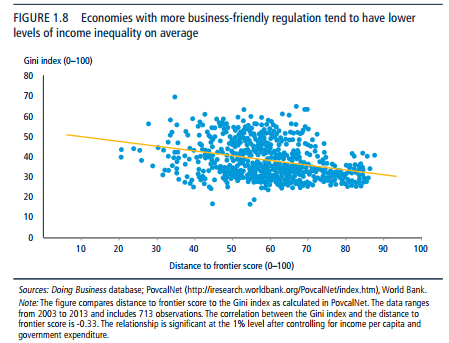
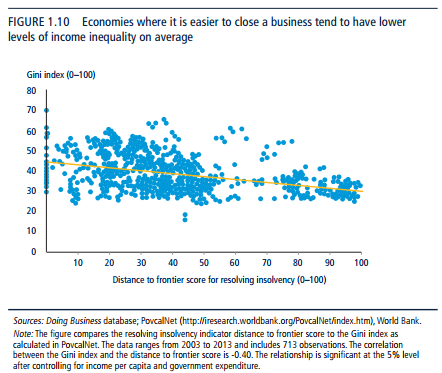
research shows that where business regulation is simpler and more accessible, firms start smaller and firm size can be a proxy for the income of the entrepreneur. Doing Business data confirms this notion. There is a negative association between the Gini index, which measures income inequality within an economy, and the distance to frontier score, which measures the quality and efficiency of business regulation when the data are compared over time (figure 1.8).

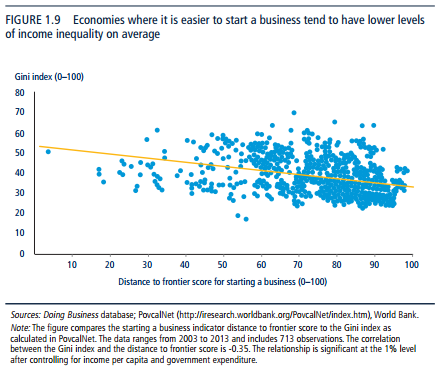
Data across multiple years and economies show that as economies improve business regulation, income inequality tends to decrease in parallel. Although these results are associations and do not imply causality, it is important to see such relation. The results differ by regulatory area. Facilitating entry and exit in and out of the market—as measured by the starting a business and resolving insolvency indicators—have the strongest link with income inequality reduction (figures 1.9 and 1.10). These two Doing Business indicators are focused on equalizing opportunities and access to markets (pgs. 11-12).

In short, lower income inequality is correlated with simpler, business-friendly regulations. Anyone worried about income inequality should take note.

I recommend taking a look at the data for yourself. Lots of good stuff.

Meaningless Secular Democracies and Islamic Exceptionalism

Image result for islam

According to Brookings scholar Shadi Hamid, liberal democracies offer little meaning for many Muslims across the world. The Atlantic summarizes his view:

History will not necessarily favor the secular, liberal democracies of the West. Hamid does not believe all countries will inevitably follow a path from revolution to rational Enlightenment and non-theocratic government, nor should they. There are some basic arguments for this: Islam is growing, and in some majority-Muslim nations, huge numbers of citizens believe Islamic law should be upheld by the state. But Hamid also thinks there’s something lacking in Western democracies, that there’s a sense of overarching meaninglessness in political and cultural life in these countries that can help explain why a young Muslim who grew up in the U.K. might feel drawn to martyrdom, for example. This is not a dismissal of democracy, nor does it comprehensively explain the phenomenon of jihadism. Rather, it’s a note of skepticism about the promise of secular democracy—and the wisdom of pushing that model on other cultures and regions. 

Most Islamists—people who, in his words, “believe Islam or Islamic law should play a central role in political life”—are not terrorists.[ref]See my post on Who Speaks for Islam?[/ref] But the meaning they find in religion, Hamid said, helps explain their vision of governance, and it’s one that can seem incomprehensible to people who live in liberal democracies.

The article continues with an interview with Hamid, which offers some interesting points not only about Islam, but about the relation between religion and politics generally:

I am arguing that Islam is exceptional. I think there’s a general discomfort among American liberals about the idea that people don’t ultimately want the same things, that there isn’t this linear trajectory that all peoples and cultures follow: Reformation, then Enlightenment, then secularization, then liberal democracy.

Where I would very much part ways with those on the far right who are skeptical about Islam is that I don’t think it’s necessarily a bad thing for Islam to play an outsized role in public life.

…There are many of us here in the U.S. who are skeptical [of theology in government], but ultimately I think it’s up to the people of the region to decide what’s best for themselves through a democratic process that would play out over time.

I see very little reason to think secularism is going to win out in the war of ideas. But the question is: Why would it in the first place? Why would that even be our starting presumption as American observers? It’s presumptuous and patronizing to think a different religion is going to follow the same basic trajectory as Christianity.

Hamid touches on Malaysia and Indonesia, two countries which are often ignored because “they’re not very central to U.S. national-security interests”:

Those two countries are often described as models of pluralism, tolerance, and relative democracy. But there are actually more sharia bylaws on the local level in those two countries than you see in much of the Arab world, including Tunisia, Egypt, Lebanon, and certainly Turkey, in the broader region.

That tells us something: It’s not just an Arab problem. It’s not just a Middle Eastern problem. What I do think is quite different is that Malaysia and Indonesia have come to terms with this reality. [Islam] doesn’t have the same kind of polarizing effect on the body politic [in those countries] as it does in the Arab world, because those two countries have reached a conservative consensus, where people say, “Yes, Islam does play an outsize role in public life, but we’re going to agree to adjudicate our differences through a democratic process, or at least not through violence.”

Unfortunately, too many Westerners refuse to take the metaphysical and spiritual claims of Islam (and religion in general) seriously:

As political scientists, when we try to understand why someone joins an Islamist party, we tend to think of it as, “Is this person interested in power or community or belonging?” But sometimes it’s even simpler than that. It [can be] about a desire for eternal salvation. It’s about a desire to enter paradise. In the bastions of Northeastern, liberal, elite thought, that sounds bizarre. Political scientists don’t use that kind of language because, first of all, how do you measure that? But I think we should take seriously what people say they believe in…There’s a desire for a politics of substantive meaning. At the end of the day, people want more than economic tinkering.

I think classical liberalism makes a lot of sense intellectually. But it doesn’t necessarily fill the gap that many people in Europe and the U.S. seem to have in their own lives, whether that means [they] resort to ideology, religion, xenophobia, nationalism, populism, exclusionary politics, or anti-immigrant politics. All of these things give voters a sense that there is something greater.

What about the supposedly inherent violence within Islam?

A question I get a lot is, “Wait, ok, is Islam violent? Does the Quran endorse violence?”[ref]This is one way we help perpetuate the myth of Islam vs. the West.[/ref] I find this to be a very weird question. Of course there is violence in the Quran. Muhammad was a state builder, and to build a state you need to capture territory. The only way to capture territory is to wrest it from the control of others, and that requires violence. This isn’t about Islam or the Prophet Muhammad; state building has historically always been a violent process.

…ISIS has gone well beyond the al-Qaeda model of terrorism and destruction…ISIS one of the most successful Islamist state-building groups. And that’s what makes it scary and frightening as an organization: They have offered a counter model. They’ve shown that capturing and holding territory is actually an objective worth striving for. An overwhelming majority of Muslims dislike ISIS and oppose them. But ISIS has changed the terms of the debate, because other Islamist groups in recent decades have not been able to govern. They have not been able to build states, and ISIS has.

One of his final thoughts is probably one of the most important:

Islamism is a very modern thing. It was inconceivable four centuries ago. In the pre-modern era [in the Islamic world], Islam imbued every aspect of public and political life. It was the unquestioned overarching legal and moral culture in these territories. With the advent of secularism as a competing idea, or ideology, for the first time Muslims have to ask themselves these kinds of questions of who they are and what their relationship to the state is. So, in that sense, Islamism only makes sense in opposition to something else that isn’t Islamism, i.e., secularism.

If I had to sum up mainstream Islamism in a sentence, I would say it’s the attempt to reconcile pre-modern Islamic law with the modern nation-state. But the problem is that Islamic law wasn’t designed for the modern nation-state. It was designed for the pre-modern era. So the question then is, “How do you take something that wasn’t meant for the modern era and adapt it to the modern era—the era of nation-states?” That is the conundrum that Islamist movements are facing.

An insightful, fascinating read.

The Rich Are Selfish, Right?

Image result for greed is good gif

“[The rich][ref]It should, of course, be noted that “the rich” are not a monolithic group.[/ref] evade taxes more often, flaunt traffic laws that protect pedestrians and donate less frequently to charity. In the aftermath of the Great Recession, there has been no shortage of reports in the popular media on their selfishness and opportunism,” write three economists at The Conversation. “…But are the rich really so different from the rest of us? In recently published research, we used a natural field experiment to try to find out.”

Their first focus is incentives and opportunities:

For instance, because rich people face a higher tax bracket, every dollar of income they hide from the tax collector benefits them more than it would a poor person. Similarly, although both rich and poor get the same penalty for a traffic law violation, a fine that would be devastating for a person in poverty amounts to a pinprick for someone who’s wealthy. And while the rich are less likely to give to charity in any one year, they instead tend to make large gifts later in their lives. So even if the rich often do behave more selfishly than the less well off, their behavior might be more the result of different circumstances rather than differing moral values.

But what does their experiment show?:

[W]e designed a field experiment in which we “misdelivered” transparent envelopes with money to over 400 rich and poor households in a medium-sized city in the Netherlands. Returning envelopes is individually costly (mostly in terms of time) but benefits the rightful recipient, making this an altruistic, “pro-social” act.

All the envelopes contained €5 (US$5.34) or €20 as well as a card with a message from a grandfather to his grandson explaining the gift. We sent the money, however, in two variations: either as banknotes that could be easily seen by anyone handling the envelope, or as a bank transfer card, which is a slip of paper that orders a bank to send money from one account to another. In other words, the cash acted as “bait,” while the bank transfer card would have had no value to the individual.

Our setup had two advantages over other studies on the topic. First, participants did not know they were being studied as part of an experiment. They were, therefore, not changing their choices for fear of what we might think of them. Second, there was no “selection bias” in our data that might have skewed the results because the rich tend to shy away from participating in experiments (possibly because they don’t have much time to participate or don’t like the idea of researchers having data on them). In our setup, every rich or poor household was randomly selected.

The overall results showed that the rich returned roughly 80 percent of all envelopes, regardless of whether it contained cash or a card. When cash was used, the rich returned only slightly less. So the rich were somewhat sensitive to the money bait, but not much. The poor, however, were much less likely to go to the trouble of returning the money and were much more vulnerable to the bait inside the envelope. They kept roughly half of the noncash envelopes and roughly three-quarters of the cash envelopes.

Does this mean the poor are the truly selfish ones? Not necessarily. In line with the point about incentives and opportunities above, the researchers used “a theoretical model” to “measure a household’s “neediness” of the cash and how financial stress changes over the course of a month. When we do so, as one might expect, we find big differences in needs and stresses between rich and poor. But what is more important is that, when we statistically remove the influence of these factors, we no longer find differences in the relative altruism of the rich versus the poor.”

They conclude,

These findings show the perils of inferring deeper motives from casual behavior. While our raw data show clear differences between the rich and poor in terms of pro-social behavior, digging a little deeper erases them. Our conclusion is that incentives are the biggest determinants of pro-social behavior and that neither the rich nor the poor are inherently kinder or more selfish – in the end all of us are susceptible to behaving this way…This is not to absolve those who evade taxes or break the law. What it suggests is that the rich are no different than the rest: If we were to put the poor in their place, they would likely behave similarly.

The Rise of Occupational Licensing

I’ve written about occupational licensing and its negative effects on economic mobility before. In May 2016,

the Bureau of Labor Statistics released its first-ever data on certification and licenses, providing the most comprehensive and reliable look to date at occupational licensing in the United States. In 2015, over 22 percent of U.S. workers held an occupational license at the State, Federal, or local level, while around 26 percent held a license or a certificate. While licensing and certification seek to ensure that workers have the necessary qualifications, especially for occupations impacting consumer safety and well-being, overly-broad application of licensing requirements can create costly and unnecessary barriers to entering a profession. Licensing can lead to higher wages for those able to obtain a license, but can also lead to inefficiency and unfairness, including reducing employment opportunities and depressing wages for excluded workers, reducing workers’ mobility across State lines, and increasing costs for consumers. 

Here are some of the highlights from the data:

  • Nearly one-quarter of U.S. workers require a license to do their jobs.

Share of Workers with an Occupational License

  • About two-thirds of the growth in licensing over time stems from an increase in the number of professions that require a license.

Percent Licensed Over Time: Estimated and Counterfactual

  • While licensing is more prevalent in high-income professions such as healthcare and law, it is common in many middle- and lower-income professions as well.

Percent Licensed by Occupation Group

  • Unlicensed workers earn less than licensed workers in the same occupation with similar demographics and educational attainment, and the wage gap is similar across high and low-wage occupations.

Hourly Wages of Licensed and Unlicensed Workers By Occupation


There’s more. Check out the entire White House post.

Want Fewer Deaths and Fewer DUIs? Ride Uber

Image result for uber

Remember when people were peddling that #deleteUber nonsense? Well, here’s a few more reasons to hate Uber[ref]Sarcasm on high.[/ref] according to a 2016 study:

Using a differences-in-differences specification and controlling for county-specific linear trends, we find that the entry of ride-sharing tends to decrease fatal vehicular crashes. Our (unweighted) estimated 1.1 percent decline in vehicle fatalities for each additional quarter are smaller than those found by Greenwood and Wattal (2015).

We…observe declines in arrests for assault and DUI. Specifically, we find that Uber’s entry lowers DUIs rates by 6 to 27 percent. The magnitude of our findings are smaller than those found by Jackson and Owens (2011) who show that DUIs decreased by 40% when the Washington DC Transit Authority expanded late night Metro transportation services. In many cases, these declines become larger the longer the service is available in an area. These beneficial declines are somewhat offset by increases in arrests for motor vehicle thefts (pg. 15).

Here are the specifics on fatal accidents:

Our unweighted estimates are consistent with Uber leading to larger declines in fatal accidents the longer the service is available. Fatal crashes decline by 0.5 percent for each additional month or 1.5 percent for each additional quarter Uber is available. Night-time fatal crashes decline by 0.9 percent for each additional month or 2.7 percent per quarter. The number of fatalities decline by 0.37 percent for each additional month or 1.1 percent for each additional quarter Uber is available. Our estimates are a third of the size as those in Greenwood and Wattal (2015) who find a “3.6% – 5.6% decrease in the rate of motor vehicle homicides per quarter [or 0.9% – 1.4% per month] in the state of California.” In the weighted regressions, the estimated effect over time tends to be smaller and statistically significant. We observe statistically significant and economically meaningful declines in fatal accidents, fatal night time accidents, and the number of fatalities the longer Uber is available.

…Overall, our findings suggest that Uber does not increase overall fatal crash rates and, for some specifications, is associated with a decline in fatal crash rates (pgs. 12-13).

And for various crimes:

The results are similar with and without weights: counties with Uber experience statistically significant declines in arrests for other assaults and DUIs. The magnitudes are economically important and typically larger for the weighted estimates. For other 14 assaults, the entrance of Uber is associated with a 11 to 18 percent decline. The availability of Uber is associated with a 6 to 27 percent decline in DUIs. Counties experience a 55 to 157 percent increases in arrests for motor vehicle thefts after the introduction of Uber. This may come from an increased propensity for Uber passengers to leave personal vehicles parked in public locations.

…For DUIs, we witness a 2.8 to 3.4 percent decline for each additional month of Uber service. We continue to observe declines in arrests for assault; each additional month of Uber availability is associated with a 2.4 percent decline in assaults in the unweighted estimate. The results for motor vehicle thefts are also consistent across specifications with some evidence of increasing thefts over time.

Because we are concerned that Uber may enter areas with characteristics that are correlated with crime rates, we restrict the sample to only those areas where Uber services have been offered…[A]rrests for DUI decline by 17 percent with the entry of Uber. Including both the entry and trend effects, the…estimates reveal a 2.7 to 3.9 percent decline in DUIs for each additional month Uber service is available. Motor vehicle thefts increase following the entry of the ride-sharing service. The results for assaults, however, become statistically insignificant.

Our estimates reveal that the introduction of Uber lowers arrests due to DUIs and may lower assaults. Overall, this suggests that the introduction of Uber increases the safety of citizens. We also witness little to no change in liquor law violations, fraud, or embezzlement. This suggests that our findings are not due to overall declines in crime rates. We do, however, witness an increase in the theft of vehicles (pgs. 13-15).

Safer societies with fewer deaths: not a bad trade-off for “selling out” at JFK airport.[ref]Doesn’t mean there aren’t other things worth criticizing Uber for (as noted in the comments below). For this post, think of Uber as proxy for “taxi competition.”[/ref]

Teachers: Made, Not Born

Teacher quality matters, according to The Economist:

Many factors shape a child’s success, but in schools nothing matters as much as the quality of teaching. In a study updated last year, John Hattie of the University of Melbourne crunched the results of more than 65,000 research papers on the effects of hundreds of interventions on the learning of 250m pupils. He found that aspects of schools that parents care about a lot, such as class sizes, uniforms and streaming by ability, make little or no difference to whether children learn (see chart). What matters is “teacher expertise”. All of the 20 most powerful ways to improve school-time learning identified by the study depended on what a teacher did in the classroom.

Eric Hanushek, an economist at Stanford University, has estimated that during an academic year pupils taught by teachers at the 90th percentile for effectiveness learn 1.5 years’ worth of material. Those taught by teachers at the 10th percentile learn half a year’s worth. Similar results have been found in countries from Britain to Ecuador. “No other attribute of schools comes close to having this much influence on student achievement,” he says.

Rich families find it easier to compensate for bad teachers, so good teaching helps poor kids the most. Having a high-quality teacher in primary school could “substantially offset” the influence of poverty on school test scores, according to a paper co-authored by Mr Hanushek. Thomas Kane of Harvard University estimates that if African-American children were all taught by the top 25% of teachers, the gap between blacks and whites would close within eight years. He adds that if the average American teacher were as good as those at the top quartile the gap in test scores between America and Asian countries would be closed within four years.

…In 2014 Rob Coe of Durham University, in England, noted in a report on what makes great teaching that many commonly used classroom techniques do not work. Unearned praise, grouping by ability and accepting or encouraging children’s different “learning styles” are widely espoused but bad ideas. So too is the notion that pupils can discover complex ideas all by themselves. Teachers must impart knowledge and critical thinking.

But the real question is this: are good teachers born or made? A 2011 “survey of attitudes to education found that such portrayals reflect what people believe: 70% of Americans thought the ability to teach was more the result of innate talent than training.” But the article notes,

Few other professionals are so isolated in their work, or get so little feedback, as Western teachers. Today 40% of teachers in the OECD have never taught alongside another teacher, observed another or given feedback. Simon Burgess of the University of Bristol says teaching is still “a closed-door profession”, adding that teaching unions have made it hard for observers to take notes in classes. Pupils suffer as a result, says Pasi Sahlberg, a former senior official at Finland’s education department. He attributes much of his country’s success to Finnish teachers’ culture of collaboration. As well as being isolated, teachers lack well defined ways of getting better…Much of what passes for “professional development” is woeful, as are the systems for assessing it. In 2011 a study in England found that only 1% of training courses enabled teachers to turn bad practice into good teaching. The story in America is similar. This is not for want of cash. The New Teacher Project, a group that helps cities recruit teachers, estimates that in some parts of America schools shell out about $18,000 per teacher per year on professional development, 4-15 times as much as is spent in other sectors.

The New Teacher Project suggests that after the burst of improvement at the start of their careers teachers rarely get a great deal better. This may, in part, be because they do not know they need to get better. Three out of five low-performing teachers in America think they are doing a great job. Overconfidence is common elsewhere: nine out of ten teachers in the OECD say they are well prepared. Teachers in England congratulate themselves on their use of cognitive-activation strategies, despite the fact that pupil surveys suggest they rely more on rote learning than teachers almost everywhere else.

I’ll stop the overquoting here, but the piece is truly worth reading in its entirety. Our teachers need better training.

Can We Still Be Optimistic With Illiberalism on the Rise?

The latest Freedom of the World report was recently released with some worrisome–though not surprising–news:

  • With populist and nationalist forces making significant gains in democratic states, 2016 marked the 11th consecutive year of decline in global freedom.
  • There were setbacks in political rights, civil liberties, or both, in a number of countries rated “Free” by the report, including Brazil, the Czech Republic, Denmark, France, Hungary, Poland, Serbia, South Africa, South Korea, Spain, Tunisia, and the United States.
  • Of the 195 countries assessed, 87 (45 percent) were rated Free, 59 (30 percent) Partly Free, and 49 (25 percent) Not Free.
  • The Middle East and North Africa region had the worst ratings in the world in 2016, followed closely by Eurasia.

The report is appropriately titled “Populists and Autocrats: The Dual Threat to Global Democracy.” We’ve written about the dangers of populism here at Difficult Run before and how closed societies are detrimental to flourishing. Despite it being “the 11th consecutive year of decline in global freedom,” it’s worth noting the long-term trend:

More people live in democracies than ever before:

Let’s hope this recent downturn in global freedom is just a blip in an overall positive trajectory.


Modern Lessons from 18th-Century Scottish Colleges

Last year, Ro had a brief piece about how Germany offers free college, not the “college experience”. The results of free college are arguably underwhelming. But the debate over college isn’t new, but can be found in the writings of Adam Smith. As The Atlantic explains,

While extravagances such as hot tubs, movie theaters, and climbing walls may seem to make this discussion distinctively modern, parts of today’s college-cost dilemma are recognizable, in fact, in an 18th-century debate about how best to finance a university’s operations. It was so important that Adam Smith took time out of analyzing more traditional economic subjects like the corn laws to devote a long section of The Wealth of Nations to it. And with cause: The Scottish universities of the 18th century, much like America’s today, had been quickly becoming the universally acknowledged ticket to social advancement.

Smith, despite accusations of Connery-esque misplaced nationalism, was justly proud of the Scottish system of universities, which ran on a radical (by today’s standards, at least) system in which students paid their professors directly…But by the end of the century, it had five of the most cutting-edge universities in Europe, one of the world’s best medical schools, and a booming professional class from which its southerly neighbor and occupier frequently drew its doctors, lawyers, and professors. It had pioneered the study of English literature as a subject, having perceived that for many of its students, raised speaking Scots or Gaelic, English actually was a foreign language. It offered up world-class Enlightenment philosophes such as David Hume, Adam Ferguson, and Adam Smith, all of whom were at least partially educated in its universities.

Smith noted the differences between the universities of Scotland and Oxford where later attended:

Image result for adam smithIn Scotland, students exercised complete consumer control over with whom they studied and which subjects they deemed relevant. Oxford—and in fact most other European universities—employed a system similar to the way that American universities handle tuition payments today: One tuition payment was made directly to the university, and the university decided how to distribute what came in…Smith points out how [Oxford] often fell short of the Scottish system, where direct payment of fees served as motivation for faculty responsibility. “The endowments of [British] schools and colleges have necessarily diminished more or less the necessity of application in the teachers,” Smith writes in his opening sally against bundling the costs of education. “In the university of Oxford, the greater part of the publick professors have, for these many years, given up altogether even the pretence of teaching.” In the the Scottish system, “the salary makes but a part, and frequently but a small part of the emoluments of the teacher, of which the greater part arises from the honoraries or fees of his pupils,” he explains.

What’s wrong with the Oxford (and contemporary universities generally) approach?

Prices are information about what people need and want, so the trouble with bundling together a large number of services on a single bill is that it becomes difficult to tell exactly what one is paying for, or for the people sending out that bill to determine what students in fact want to pay for. In the current American system, such decisions are based on fluctuation in enrollment—a very high-level piece of data that can encompass any number of students’ preferences—but not on the micro-level of whether the students of Texas Tech University, for instance, really wanted a water park instead of more or better Spanish-language instructors.

There are potential problems to the Scottish approach. For example,

evidence has recently pointed to the patent unfairness and sexism of student evaluations of their professors. Many an academic has bemoaned the growing “customer” mentality of their students, and with good reason: It can lead to grade inflation and a subsequent lowering of standards. But as Smith would surely have appreciated, the right incentives could bring 18-year-olds to seek out the highest-quality teachers rather than the most forgiving graders. That’s how it worked in Scotland in the 18th century, where there was a simple way of dealing with the problem that the best professors were not always the easiest fellows: rigorous, frequent, and comprehensive oral and essay examinations, which were administered in lieu of evaluations in individual courses. Students were allowed to select which university services and which university teachers they would pay for, but in the end if they could not pass a university-wide exam, their choice to take the 18th-century equivalent of Rocks for Jocks would have been swiftly punished.

The entire article is interesting. Check it out.

Unsatisfied Retirees

Retirement may not be all it’s cracked up to be. A MarketWatch article reports,

More retirees than ever say they are “not at all satisfied” with retirement, according to a study published this year from the Employee Benefit Research Institute. The institute used data from the University of Michigan’s Health and Retirement Study, collected from 1998 to 2012, in which more than 20,000 people are interviewed every two years.

The number of retirees reporting just moderate satisfaction with retirement increased from 31.7% to 40.9% and those who are completely unsatisfied with retirement climbed above 10%, up from fewer than 8% in 1998. Meanwhile, the number of retirees who say their retirement is “very satisfying” has dropped from 60.5% in 1998 to 48.6% in 2012 — the first time it’s ever dipped below half.

The study authors did not investigate the reasons behind these satisfaction dips, but other studies suggest that some of the reasons may be financial. Research published in 2004 by Constantijn Panis, who has a Ph.D. in economics and is also an expert in demographic issues, found that getting payouts from a pension was positively related to retirement satisfaction. But as the number of retirees drawing on traditional pensions declined — from 1980 to 2008, the proportion of non-government, salaried workers who got a traditional pension fell from 38% to 20% — retirement satisfaction may be dipping accordingly.

…Studies show that today’s retirees want more and varied activities in retirement, including flexible jobs, than did previous generations of retirees. Plus, surveys show that boomers — who are retiring in droves in recent years — are in general less happy than members of the so-called silent generation, and that may be reflected in these numbers.

Of course, it’s worth noting that the overwhelming majority report being satisfied with retirement. We shouldn’t create a crisis where there is none. Nonetheless, the uptick may be something we want to keep an eye on. In the Gallup-published Wellbeing: The Five Essential Elements, the authors Tom Rath and Jim Harter explore five elements to overall well-being:

  • Career Wellbeing – how one’s time is occupied.
  • Social Wellbeing – the strength of one’s relationships.
  • Financial Wellbeing – effectively managing one’s economic life.
  • Physical Wellbeing – having good health and enough energy on a daily basis.
  • Community Wellbeing – engagement with the area in which one lives.

In regards to Career Wellbeing, Rath and Harter reveal this significant point about the need to work:

One of the more encouraging findings [of one study] was that, even in the face of some of life’s most tragic events like the death of a spouse, after a few years, people do recover to the same level of wellbeing they had before their spouse passed away. But this was not the case for those who were unemployed for a prolonged period of time — particularly not for men. Our wellbeing actually recovers more rapidly from the death of a spouse than it does from a sustained period of unemployment. This doesn’t mean that getting fired will harm your wellbeing forever. The same study also found that being laid off from a job in the last year did not result in any significant long-term changes. The key is to avoid sustained periods of unemployment (more than a year) when you are actively looking for a job but unable to find one. In addition to the obvious loss of income from prolonged unemployment, the lack of regular social contact and the daily boredom might be even more detrimental to your wellbeing.

This is likely why the MarketWatch article encourages retirees to “find things you love to do” and “plan how to use your time.” Wise advice.

Is the EPI Correct About Wages and Productivity?

Image result for epi wages productivity

The above chart from the Economic Policy Institute has become a staple in the “wage stagnation” debate. I talked about it before a couple years ago, but I thought I’d revisit it since there have been a couple responses to the EPI since then. Scott Winship, formerly of Brookings and now at the Manhattan Institute, writes,

The Economic Policy Institute (EPI)…has created a widely cited chart indicating that productivity rose 72 percent during 1973–2014 while median hourly compensation rose by a measly 9 percent. The implication is that rising inequality and declining employer generosity mean that policies that promote economic growth will fail to lift middle-class living standards and that more redistribution is necessary to assist working families.

In arriving at this conclusion, EPI makes numerous faulty methodological decisions. It understates growth in median hourly compensation by using a deficient inflation adjustment and by undervaluing benefits other than health insurance. It overstates the divergence between productivity and median hourly compensation trends by using different inflation adjustments for each. It includes imputed rents in national income, which exerts a downward pull on labor’s share of income. It includes the self-employed in its analyses, for whom it makes little sense to distinguish between labor income and capital income. And it includes government and nonprofit workers, whose productivity is not well measured (pg. 4).

Winship instead finds the following:

  • During 1973–2007, U.S. hourly compensation rose 71 percent, while productivity rose 74 percent.
  • In 1973, U.S. workers received 70 percent of the income produced by businesses; in 2007, they received 69 percent.
    • For the past 70 years, labor’s share of income has fluctuated—almost without exception—between 67 percent and 71 percent.
  • Since 1929, the U.S. business cycles with the highest productivity growth have also featured the highest growth in hourly compensation.
  • Male and female middle-class workers saw faster growth in pay during 1989–2000 and 2000–07 than during 1973–79, when productivity growth was slower.
  • Middle-class pay has not stagnated: during 1997–2011, productivity rose by 35 percent, aggregate compensation rose by 32 percent, median hourly compensation increased by 20 percent, median female pay climbed by 25 percent, and median male pay grew by 18 percent.

According to the Heritage Foundation’s James Sherk,[ref]Before dismissing Heritage as Koch-bought, right-wing hackery, it might be worth pointing out that 27% of the EPI’s funding comes from unions and its Board of Directors chairman is the president of AFL-CIO. Heritage isn’t my go-to source for much of anything, but this is the most in depth analysis I’ve read of the EPI’s claims.[/ref]

Academic economists largely reject this analysis and the conclusion that salary no longer grows with productivity. Harvard professor Martin Feldstein, the former president of the National Bureau of Economic Research, concluded that the apparent divergence results from comparing the wrong data. Using the correct data, he finds that pay and productivity have both grown together. Staff at the Federal Reserve Bank of St. Louis found the same result.

Even prominent liberal economists who have examined this question agree. Dean Baker, director of the Center for Economic and Policy Research, finds that pay growth tracks productivity growth when comparing the same groups of workers and using the same measure of inflation. Harvard professor Robert Lawrence served on President Bill Clinton’s Council of Economic Advisers; he comes to the same conclusion. George Washington University professor Stephen Rose—a former Clinton Administration Labor Department official currently affiliated with the Urban Institute—likewise finds that the apparent gap between pay and productivity collapses under scrutiny. He concludes that productivity growth continues to benefit working Americans.

Most economists who examine the issue conclude that firms pay workers according to the value they produce.

In my view, one of the most glaring errors of the EPI’s methodology is the following:

EPI compares compensation for production and non-supervisory employees—which covers about five-eighths of the total economy—to the productivity of all workers in the economy. Economic theory does not predict that the pay and productivity of different groups of employees will necessarily track each other, especially in the presence of barriers to mobility.

Even abstracting from analytical errors, EPI can claim no more than that pay and productivity have grown differently among different groups of workers. EPI’s data say nothing about whether workers’ pay has grown in step with their own productivity.

Check out the full analyses by both Winship and (especially) Sherk.