Such is the goal of Jonathan Haidt and Linda Trevino in a recent Nature article. “Imagine a world,” they write,
in which medical researchers did experiments on rats, but never on people. Furthermore, suppose that doctors ignored the rat literature entirely. Instead, they talked to each other and swapped tips, based on their own clinical experience. In such a world medicine would not be the cumulative science that we know today.
That fanciful clinical world is the world of business ethics research. University researchers do experiments, mostly on students who come into the lab for pay or course credit. Experiments are run carefully, social and cognitive processes are elucidated, and articles get published in academic journals. But business leaders do not read these journals, and rarely even read about the studies second-hand. Instead, when they think and talk about ethics, they rely on their own experience, and the experience of their friends. CEOs share their insights on ethical leadership. Ethics and compliance officers meet at conferences to swap ‘best practices’ that haven’t been research-tested. There are fads, but there is no clear progress.
The authors argue that societies “would be vastly better off if we could improve business ethics. Efficiency would improve (http://www.ethicalsystems.org/content/ethics-pays), enlarging the pie, and workers would be treated better, removing some of the animus directed toward capitalism and free trade in recent years.” However, three obstacles stand in the way:
The hyper-complexity of business ethics: Proper business ethics requires understanding of “the individual, the group, and the legal and cultural ecosystem” as well as “the alignment (or misalignment) across levels, and within each level.”
The risk aversion of firms: “Why take unnecessary risks by inviting strangers in to poke around and ask questions, knowing that these strangers will then publish their findings, even if they say they will hide the name of your company? Request denied.”
The siloed data problem: “[W]hen it comes to sharing data, the walls are higher. Data is normally kept private and only shared with other researchers under limited conditions, particularly when it benefits the researchers in some way. When those data are (rarely) gathered from real companies, which are concerned about downside risk, the walls are even higher…Most companies collect little or no data about their ethical culture, and if they do, they most likely would not share it with anyone.”
Haidt and Trevino continue,
What can we do to get the business and research communities together, and to establish the sorts of long-standing trusting relationships that can lead to longitudinal studies in which data is gathered using the same instruments over the course of several years and many companies, while various interventions are tested? This is the holy grail of business ethics research.
In 2014, a group of ethics researchers from many subdisciplines came together to form a research collaborative called Ethical Systems (see EthicalSystems.org). We were formed to address the hyper-complexity problem. We began by summarizing the existing research on topics as varied as accounting, fairness, business law, human rights, conflicts of interest, ethical culture, and whistle-blowing. Our initial goal was to aggregate the vast and varied research literature and make it accessible — always for free — to business leaders and especially to ethics and compliance officers. (Because culture and regulatory frameworks differ by country, we have limited our work to the United States so far, but we plan to expand globally in the future.)
Our second goal was to bring researchers together from multiple subfields and link them to the many business leaders who have begun to realize that they can’t just focus on compliance with regulations; they must invest in improving their ethical cultures. We have found a great deal of interest in working together from all the relevant groups — including federal regulators.
President (then Elder) Thomas S. Monson was the first speaker during the Friday afternoon session of the October 1975 General Conference, but we’ll never know what talk he planned to give because he threw it away:
In the balcony to my left I see a beautiful girl of perhaps ten years. Sweet little one, I do not know your name or whence you have come. This, however, I do know: the innocence of your smile and the tender expression of your eyes have persuaded me to place aside for a future time the message I had prepared for this occasion. Today, I am impressed to speak to you.
The story that followed was poignant and sad, but the thing I couldn’t help but noticing was the amount of humility implicit in how President Monson shared this story. He mentioned others being inspired—like President Benson, who sent him to Louisiana in response to a prompting—but he never talked about any inspiration of his own.
In contrast, he described himself making the wrong decision and then being corrected by the Lord. When considering whether or not he would make the trip to visit a sick little girl, he reports that:
I examined the schedule of meetings for that evening and the next morning—even my return flight. There simply was no available time. An alternative suggestion came to mind. Could we not remember the little one in our public prayers at conference? Surely the Lord would understand. On this basis, we proceeded with the scheduled meetings.
But this was not the right decision. As he prepared to start his meeting:
I was sorting my notes, preparing to step to the pulpit, when I heard a voice speak to my spirit. The message was brief, the words familiar: “Suffer the little children to come unto me, and forbid them not: for of such is the kingdom of God.” (Mark 10:14.) My notes became a blur. My thoughts turned to a tiny girl in need of a blessing. The decision was made. The meeting schedule was altered. After all, people are more important than meetings. I turned to Bishop James Serra and asked that he leave the meeting and advise the [family].
And so he travelled to the bedside of a dying girl and, there he found holiness.
I have been in hallowed places—even holy houses—but never have I felt more strongly the presence of the Lord than in [her] home.
He gave her a blessing, but he does not record what that blessing contained. Only that, four days following, the little girl passed away. Some might ask why—if an apostle was guided to Louisiana and then specifically to the home of this sick girl—she could not be spared. That is an issue I will not tackle today.
Instead, I simply want to observe that President Monson’s story itself has a childlike quality of love, trust, and humility. His story was not only about a child and delivered to a child, but exemplified how we can be like children ourselves.
Once again, the supposed link between immigrants and crime was peddled by President Trump with the announcement of VOICE: Victims Of Immigration Crime Engagement office. “We are providing a voice to those who have been ignored by our media, and silenced by special interests,” Trump said in his joint address to Congress this past Tuesday.
But the scare over immigrant criminality is, frankly, nothing more than fear-mongering. “Research has shown virtually no support for the enduring assumption that increases in immigration are associated with increases in crime,” write sociologist Robert Adelman and criminologist Lesley Reid.
Immigration-crime research over the past 20 years has widely corroborated the conclusions of a number of early 20th-century presidential commissions that found no backing for the immigration-crime connection. Although there are always individual exceptions, the literature demonstrates that immigrants commit fewer crimes, on average, than native-born Americans.
Also, large cities with substantial immigrant populations have lower crime rates, on average, than those with minimal immigrant populations.
Drawing on their recent study that “analyzed census data spanning four decades from 1970 to 2010 for 200 randomly selected metropolitan areas,” Adelman and Reid explain that an increase in immigration led to a decrease in murder, robbery, burglary, and larceny (on average). They conclude, “These associations are strong and stable evidence that immigration does not cause crime to increase in U.S. metropolitan areas, and may even help reduce it.”
Researchers Charis Kubrin and Graham Ousey also find that “[c]ities and neighborhoods with greater concentrations of immigrants have lower rates of crime and violence, all else being equal…In one study, for example, we found that cities with historically high immigration levels are especially likely to enjoy reduced crime rates as a result of their immigrant populations.” One of the more exciting bits of research is their forthcoming article in The Annual Review of Criminology:[ref]Be on the look out for the title “Immigration and Crime: Assessing a Contentious Issue” probably early next year. William & Mary have a nice write-up here.[/ref]
We conducted a meta-analysis, meaning we systematically evaluated available research on the immigration-crime relationship in neighborhoods, cities and metropolitan areas across the U.S. We examined findings from more than 50 studies published between 1994 and 2014[.]
Our analysis of the literature reveals that immigration has a weak crime-suppressing effect. In other words, more immigration equals less crime.
There were some individual studies that found that with an increase in immigration, there was an increase in crime. However, there were 2.5 times as many findings that showed immigration was actually correlated with less crime. And, the most common finding was that immigration had no impact on crime.
The upshot? We find no evidence to indicate that immigration leads to more crime and it may, in fact, suppress it.
The heated debate over school choice was sparked again by the nomination and appointment of Betsy DeVos to Secretary of Education. I’m not so much interested in DeVos as I am the evidence regarding school choice. One professor claims that economists are skeptical of school choice, with only 1/3 of economists supporting it. John Oliver has even taken charter schools to task.[ref]If you need a rundown on what a charter school actually is, this NPR article is helpful.[/ref] As Reason summarizes,
Oliver’s segment…was almost unrelieved in its criticism of charters. Echoing the talking points of major teachers unions and liberal interest group such as People for the American Way and the NAACP, the HBO host attacked charters for being unaccountable to local and state authorities (this is not true, as all state charter laws have various types of oversight rules built into them), “draining” resources from traditional public schools (which presumes tax dollars for education belong to existing power structures), and skimming students (in fact, charters teach a higher percentage of racial and ethnic minorities than traditional public schools; they also serve a higher percentage of economically disadvanataged kids). Which is not to say that Oliver is all wrong in his analysis. For instance, he ran through a series of charters that were criminally mismanaged and deserved to be shut down (even as he glossed over the fact that failing charters, unlike failing traditional schools, are more likely to be closed). And he’s right to argue that, on average, charters perform about the same as regular public schools. However, such comparisons tell us very little about whether charters do help those at-risk students better than traditional schools. On this score, there is very little doubt that charters do more with less money and fewer resources.
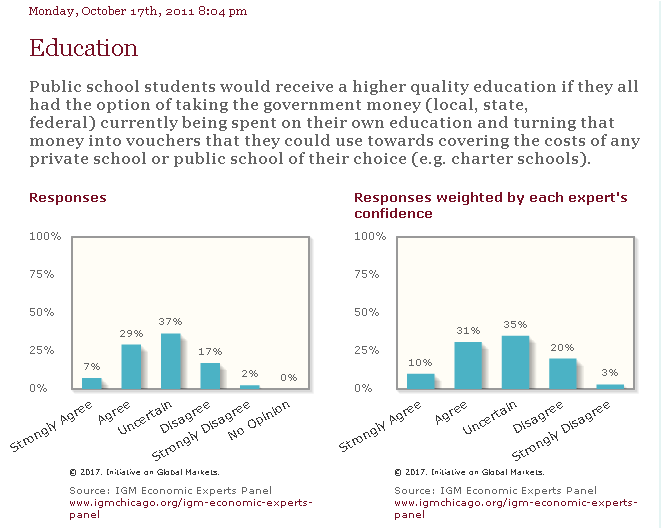
So what is the evidence? First and foremost, the claim “only a third of economists on the Chicago panel agreed that students would be better off if they all had access to vouchers to use at any private (or public) school of their choice” is misleading if not technically incorrect. Here’s the poll:
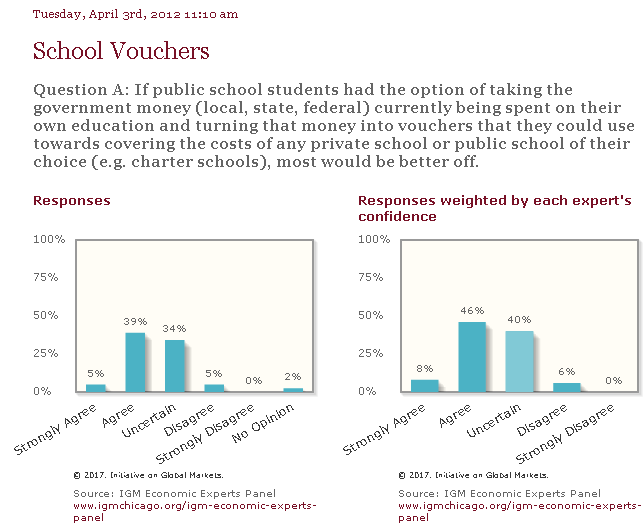
As Slate Star Codex responds, “A more accurate way to summarize this graph is “About twice as many economists believe a voucher system would improve education as believe that it wouldn’t.” By leaving it at “only a third of economists support vouchers”, the article implies that there is an economic consensus against the policy. Heck, it more than implies it – its title is “Free Market For Education: Economists Generally Don’t Buy It”. But its own source suggests that, of economists who have an opinion, a large majority are pro-voucher.” This is especially true when you look at a more recent poll:
But what about empirical evidence? Harvard’s Martin West sums up the evidence for school choice as such:
First, the benefits of attending a private school are greatest for outcomes other than test scores—in particular, the likelihood that a student will graduate from high school and enroll in college. Second, attending a school of choice, whether private or charter, is especially beneficial for minority students living in urban areas. These findings support the case for continued expansion of school choice, especially in our major cities. They also raise important questions about the government’s reliance on standardized test results as a guide for regulating the options available to families.
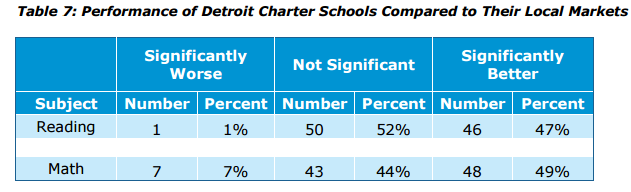
For example, a 2013 study found that private-school vouchers have no significant effects on college enrollment except for African-American and Hispanic students. The impact on the former was substantial, while the latter was small and statistically insignificant. Another study that has been trumpeted as demonstrating that “Detroit’s charter schools performed at about the same dismal level as its traditional public schools” actually supports quite the opposite.
CREDO, 2013, pg. 44.
The study concludes,
Based on the findings presented here, the typical student in Michigan charter schools gains more learning in a year than his TPS counterparts, amounting to about two months of additional gains in reading and math. These positive patterns are even more pronounced in Detroit, where historically student academic performance has been poor. These outcomes are consistent with the result that charter schools have significantly better results than TPS for minority students who are in poverty (pg. 44).
Margaret Raymond, Director of Stanford’s Center for Research on Education Outcomes (CREDO),[ref]The group behind the study mentioned above.[/ref] authored a Huffington Post piece to correct some misperceptions about what the evidence shows regarding charter schools. Referring to a 2013 study, Raymond writes,
The main findings of the report are as follows. Over the course of a school year, charter school students learn more in reading than district public schools — it is as if the charter school students attended about seven more days of school in a typical school year. The learning in math is not statistically different (not worse as she claims).
[But these] results…are the average one-year growth, blending brand new charter school enrollees with students with longer persistence. When the length of time a student attends a charter school is taken into account, the results are striking: In both reading and math, we discovered that students’ annual progress rose strongly the longer they attended charter schools. For students with four or more years in charter schools, their gains equated to an additional 43 days of learning in reading and 50 additional days of learning in math in each year.
Second, the results showed strong improvement for the sector overall — the proportion of charter schools outperforming their local district schools rose and the share that underperformed shrank in both reading and math compared to performance four years earlier. The shift in performance is neither idle drift nor nefarious conduct on the part of charter schools — we found no differences in the demography of students served by charter schools over the period.
…Urban low income and minority students are the ones best advantaged in charter schools. CREDO released “The Urban Charter School Study“ in 2015, a report conveniently overlooked by Weingarten. We found that gains in urban charter schools are dramatic overall (equivalent to 28 days of additional learning in reading and 40 days of additional learning in math every year) but for low income minority students they are nothing short of liberating: as much as 44 extra days of learning in reading and 59 extra days in math.
Jay P. Greene, Distinguished Professor and Head of the Department of Education Reform at the University of Arkansas, notes,
[W]e have four RCTs on the effects of charter schools that allow us to know something about the effects of charter schools with high confidence. Here is what we know: students in urban areas do significantly better in school if they attend a charter schools than if they attend a traditional public school. These academic benefits of urban charter schools are quite large. In Boston, a team of researchers from MIT, Harvard, Duke, and the University of Michigan, conducted a RCT and found: “The charter school effects reported here are therefore large enough to reduce the black-white reading gap in middle school by two-thirds.”
The same Stanford researcher conducted an RCT of charter schools in Chicago and found: “students in charter schools outperformed a comparable group of lotteried-out students who remained in regular Chicago public schools by 5 to 6 percentile points in math and about 5 percentile points in reading…. To put the gains in perspective, it may help to know that 5 to 6 percentile points is just under half of the gap between the average disadvantaged, minority student in Chicago public schools and the average middle-income, nonminority student in a suburban district.”
And the last RCT was a national study conducted by researchers at Mathematica for the US Department of Education. It found significant gains for disadvantaged students in charter schools but the opposite for wealthy suburban students in charter schools. They could not determine why the benefits of charters were found only in urban, disadvantaged settings, but their findings are consistent with the three other RCTs that found significant achievement gains for charter students in Boston, Chicago, and New York City.
When you have four RCTs – studies meeting the gold standard of research design – and all four of them agree that charters are of enormous benefit to urban students, you would think everyone would agree that charters should be expanded and supported, at least in urban areas. If we found the equivalent of halving the black-white test score gap from RCTs from a new cancer drug, everyone would be jumping for joy – even if the benefits were found only for certain types of cancer.
I find that winning a lottery for admission to a preferred school at the high school level reduces the total number of felony arrests and the social cost of crime. Among middle school students, winning a school-choice lottery reduces the social cost of crime and the number of days incarcerated. Importantly, I find that these overall reductions in criminal activity are concentrated among students in the highest-risk group. Indeed, I find little impact either positive or negative of winning a school-choice lottery on criminal activity for the 80 percent of students outside of this group.
Consider first the results for high school students in the high-risk group. Among these students, winning admission to a preferred school reduces the average number of felony arrests over the study period from 0.77 to 0.43, a pattern driven largely by a reduction of 0.23 in the average number of arrests for drug felonies (see Figure 2). The average social cost of the crimes committed by high-risk lottery winners (after adjusting the cost of murders downward) is $3,916 lower than for lottery losers, a decrease of more than 35 percent. (Without adjusting for the cost of murder, I estimate the reduction in the social cost of crimes committed by lottery winners at $14,106.) High-risk lottery winners on average commit crimes with a total expected sentence of 35 months, compared to 59 months among lottery losers.
Among high-risk middle-school students, I find no effect of winning a school-choice lottery on the average number of felony arrests. Although the number arrests for violent felonies falls, this is offset by an increase in the number of property arrests. Because violent crimes carry greater social costs, however, winning a school-choice lottery reduces the average social cost of the crimes committed by middle school students by $7,843, or 63 percent. It also reduces the total expected sentence of crimes committed by each student by 31 months (64 percent).
For the nation’s 17-year-olds, there have been no gains in literacy since the National Assessment of Educational Progress began in 1971. Performance is somewhat better on math, but there has still been no progress since 1990. The long-term stagnation cannot be attributed to racial or ethnic differences in the U.S. population. Literacy scores for white students peaked in 1975; in math, scores peaked in the early 1990s.
International literacy and numeracy data from the OECD’s assessment of adult skills confirms this troubling picture. The numeracy and literacy skills of those born since 1980 are no more developed than for those born between 1968 and 1977. For the average OECD country, by contrast, people born between 1978 and 1987 score significantly better than all previous generations.
Comparing the oldest—those born from 1947 to 1957—to youngest cohorts—those born from 1988 to 1996, the U.S. gains are especially weak. The United States ranks dead last among 26 countries tested on math gains, and second to last on literacy gains across these generations. The countries which have made the largest math gains include South Korea, Slovenia, France, Poland, Finland, and the Netherlands.[ref]This is the difference between cognitive skills and merely going to school.[/ref]
Rothwell in part points to “a decline in bureaucratic efficiency” in primary and secondary education.[ref]He also acknowledges “that teaching itself has become increasingly unattractive.” We could maybe learn from Finland in this regard.[/ref] With declining productivity in schools, it’s worth pointing out that some economic evidence finds that competition in public-school districts boosts school productivity, raises student achievement, and decreases spending. Furthermore, recent evidence shows that “autonomous government schools” (e.g., charters) have higher management quality than regular public or private schools. This higher management quality in turn is strongly linked to better pupil outcomes.
For reading impacts, overall, we find positive effects of about 0.17 standard deviations (null for US programs, 0.24 standard deviations for non-US programs)…For math scores, we report 10 meta-analytic ITT effect sizes (seven in the US and three outside of the US). Overall, vouchers have a positive effect on math of 0.11 standard deviations, 0.07 standard deviations in the US and 0.15 standard deviations outside of the US.
The overall results just described in this section are for the final year of data in each study. It could be that these effects are not representative of the initial effects one might expect from a new program. In fact, our analysis of the effects by year indicates that the effects of private school voucher programs often start out null in the first one or two years and then turn positive. Longer-term achievement effects, of course, are much more salient than immediate achievement effects whenever longer-term effects are available
…Additionally, in terms of policy implications, it is critical to consider the cost-benefit tradeoffs associated with voucher programs. Wolf & McShane (2013) and Muralidharan et al. (2015) found that vouchers are cost effective, since they tend to generate achievement outcomes that are as good as or better than traditional public schools but at a fraction of the cost. The greater efficiency of school choice in general and school vouchers in particular are another fruitful avenue for scholarly inquiry (pgs. 39-41).
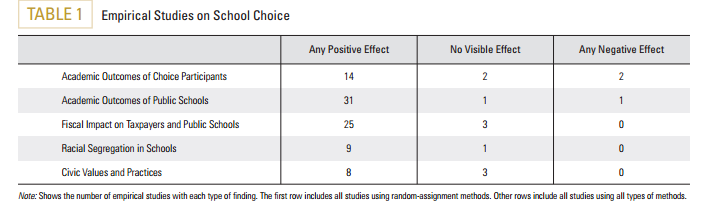
Another 2016 study looked at the various empirical studies that have been conducted on school choice. The following chart lists the key findings:[ref]Some of the negative findings were arguably due to overregulation.[/ref]
Forster, 2016, pg. 2.
Given these positive findings, it’s little wonder that a majority of Americans are dissatisfied with our education system while a large majority support school choice (especially parents). Granted, there are empirically-tested ways to improve regular public schools and I’m all for it. But with the evidence above, maybe school choice isn’t the bogeyman it has been made out to be.[ref]A bogeyman largely created by teachers’ unions, which tend to harm children’s prospects.[/ref]
Maybe I shouldn’t read about this because it will make me sad.
I get easily annoyed with people who are always prescribing “uplifting” and “positive” forms of entertainment, reading material, etc. The typical claim is that darker material “normalizes” evil, influences us to do evil, or gets us down. However, psychological research has discovered the benefits of studying evil. “While probing into the vile and the profane can be profoundly uncomfortable,” an article at UCB’s Greater Good Science Center explains, “there are concrete benefits to doing so.”
From an evolutionary perspective, familiarizing yourself with what you fear and dread likely pays survival dividends. “You would pay attention to, and have interest in, the horrific,” writes Penn State psychologist Marissa Harrison, “because in the ancestral environment, those who ‘tuned in’ to horrible events left more descendants, logically because they were able to escape harmful stimuli.” Those attuned to members of a rival tribe plotting an assault, for example, would have been better able to defend themselves, warn others, or flee before it was too late.
Even today, our self-preservation impulse helps explain our determined attempts to understand evil. In a 2010 study of why women were drawn to true-crime books, University of Illinois psychologists argued it was at least in part “because of the potential life-saving knowledge gained from reading them.” “We can ill afford to overlook a potentially dangerous person or situation—it could be fatal,” says University of Richmond psychologist Scott Allison.
But more than this, the study of evil can improve character:
A 2012 study reveals that immersion in the reality of genocide motivates people to combat prejudice when they see it. College students who took a 15-week course in Holocaust and Genocide Studies said the course awakened their desire to fight discrimination and empowered them to make changes in the world around them. A Scottish government study reported that Holocaust education programs achieved similar results with elementary-aged students; after the programs, most were more likely to state that racism was unacceptable.
Naturally,
it is possible to overdose on evil, so to speak—to focus on it so intently that your entire outlook darkens, your frame of reference narrows, and you descend into apathy. This risk intensifies when examples of depravity start flying at you fast and furious, as during a personal crisis or a governmental upheaval.
Looking closely at your motivations and thought patterns can help you determine if your fixation on the malign serves you or holds you back. If your obsession ends at poring over online morgue photos of murder victims or bidding on serial killers’ paintings on eBay, it’s probably not all that helpful, to you or to society at large.
But if your venture into the depths of human evil motivates you to resist evil in the real world or educate others about how to resist it, it’s a productive—even virtuous—use of your time. It may help to seek company when you visit a museum or even read a book. In other words, get yourself a buddy or a team to help you try to understand evil, to help keep things in perspective.
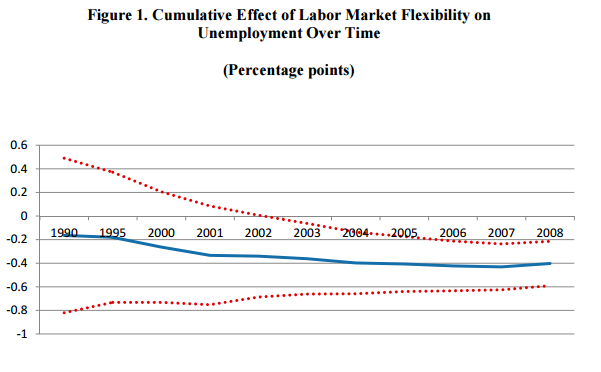
…A well-functioning and efficient labor market is, no doubt, one of the ingredients which account for Denmark’s economic prosperity. It is certainly responsible for the low unemployment rates the country has enjoyed over the last decades. The Danish experience should open the eyes of those European governments that refuse to undertake reforms which liberalize their labor markets. The evidence is clear: labor flexibility results in lower unemployment. Will the Danish example be followed by those countries badly hit by the plague of unemployment?
The papers the author cites are worth highlighting. The first is a 2012 IMF paper analyzing 97 countries from 1985 to 2008. The researchers report,
Our findings indicate that, after controlling for other macroeconomic and demographic variables, increases in the flexibility of labor market regulations and institutions have a statistically significant negative impact both on the level and the change of unemployment outcomes (i.e., total, youth, and long-term unemployment). Among the different labor market flexibility indicators analyzed, hiring and firing regulations and hiring costs are found to have the strongest effect.
Overall the results of the paper suggest that policies that enhance labor market flexibility should reduce unemployment. At the same time, this raises the issue of the design and possible sequence of such reforms, and the adoption of policies aimed also to improve the quality of employment and to minimize possible negative short-term effects, not investigated in this paper, on inequality and job destruction. While data available for our large set of countries lack the necessary level of details to answer this question, micro- and macro-studies on OECD countries over the decade showed that it is important to protect workers, rather than jobs, by coupling of unemployment benefits with pressure on unemployed to take jobs and measures to help them (Blanchard, 2006). Moreover, employment protection should be designed in such a way to internalize social costs and not inhibit job creation and labor reallocation. Artificial restrictions on individual employment contracts should also be avoided (pg. 12).
Bernal-Verdugo et al., 2012, pg. 13.
The next piece is a 2016 working paper that explores labor markets in Italy from 2001-2013. It explains,
Why have unemployment dynamics been so different in European countries? One of the most often cited explanation is the difference in labor market institutions that prevents wages from adjusting downward. If wages cannot decline, negative aggregate demand shocks (such as the Great Recession) result in unemployment growth. On the other hand, if wages can fall, labor markets reach a new equilibrium with unemployment rates returning to normal levels. Downward adjustment of wages in response to macroeconomic shocks is especially important in the euro area where labor markets cannot accommodate shocks through exchange rate depreciation or through internal labor mobility (migration among EU countries is much more limited than, for example, labor mobility across US states).
…We find that the wage differential between formal/regulated and informal/unregulated sectors has increased after 2008. Moreover, while wages in the informal sector decreased by about 20 percent in 2008-13, wages in the formal sector virtually did not fall. This is consistent with the view of a substantial downward stickiness of wages in the regulated labor market. Importantly, before the recession, wages in the formal and informal sectors moved in parallel — confirming the validity of the parallel trends assumption required for a difference-in-differences estimation and showing that both regulated and unregulated labor markets have a similar degree of upward flexibility of wages.
We also analyze the impact of the crisis on formal and informal employment. We find that formal employment decreases substantially while informal employment does not change. Since the aggregate demand shock affects both labor markets, this finding implies that upon losing a job in the formal sector at least some workers move to the informal sector. We calibrate a simple model describing such spillovers between formal and informal labor markets. Using the existing estimates for demand and supply elasticities for the Italian labor market, we estimate the degree of integration of formal and informal sector (i.e. the share of workers who move from the formal to the informal labor market after the crisis). Our model also allows to carry out a counterfactual analysis of the formal sector’s response to crisis in a scenario where formal wages were fully flexible. We find that in this case the crisis would have resulted in a much smaller decline in formal employment between 2008 and 2013 (1.5-4.5 percent rather than the actual 16 percent) (pg. 3-4).
Gallup’s Jonathan Rothwell conducted a study toward the end of last year that found “those who view Trump favorably have not been disproportionately affected by foreign trade or immigration, compared with people with unfavorable views of the Republican presidential nominee. The results suggest that his supporters, on average, do not have lower incomes than other Americans, nor are they more likely to be unemployed.” Now, Rothwell is back with another study suggesting that the supposed “China Shock” is actually overblown. Rothwell writes,
…[O]ne important achievement of [Autor, Dorn, Hanson, 2013] is its innovative methodology and framework, which has allowed scholars to better understand how import competition affects local areas. Nonetheless, my analysis and extension — which greatly benefited from Autor et al.’s coding and data — conclude that their findings about the harm from import competition at the community level are not robust, beyond the manufacturing sector, and, even then, only in the later period. At the individual level, and consistent with results from Autor et al. (2014), I find that workers in import-intensive industries have a strong attachment to the labor force and are as likely to be employed as workers in other industries.
…Though [Autor et al.’s] paper makes an enormous methodological contribution and provides further and robust evidence that Chinese imports—rather than only technological change—reduced U.S. manufacturing employment, the evidence presented here suggests the paper’s most important findings do not withstand further scrutiny.
…If China had remained a communist country and closed to trade, it is quite likely that manufacturing workers around the world would have enjoyed higher wage growth. While manufacturing job loss probably would not have been as significant, the increased competition from China did not create labor market conditions that appear dramatically different than what workers face in other industries such as retail, restaurants and engineering firms. In fact, the evidence is clear that manufacturing work remains a source of relatively high pay, long tenure, and low layoff risk, despite the intensity of import competition (pg. 20).
What is likely surprising to many, Rothwell found that
for the 1990-to-2000 period, there is no evidence that import competition resulted even in manufacturing job loss. Indeed, many of the manufacturing-specific models show that import competition resulted in a large increase in the average wages of manufacturing workers. The positive wage effect is evident outside of the manufacturing sector, particularly for noncollege educated workers and males. Taken literally, these models show that import competition during the 1990s caused a substantial increase in wages for the average worker. These models also show that import competition increased employment growth for college-educated, nonmanufacturing-sector workers and population growth for people aged 35 to 64.
Of the 45 models with significant effects in the stacked regression, only five retain significance in the expected direction during 1990 to 2000, and each of these pertain to transfer payments. These results could be explained by the population growth of pre-retirement-age workers, as health problems and risk of retirement are increasingly sharply with age. Overall, it appears that import competition in the 1990s was, if anything, largely beneficial to the average worker in the local areas most exposed to competition (pg. 18).
A new job market paper deals another blow to the “China Shock” theory. Using microdata from the US Census Bureau, the author
showed that the employment of US manufacturing firms rose in response to increasing Chinese imports in US output markets. More exposed firms expanded employment (i) in manufacturing, as they hired production workers whom they paid higher wages, and (ii) in non-manufacturing, by adding jobs in R&D, design, engineering, and headquarters services. In other words, China caused a relative expansion of US employment in firms operating in industries that experienced the largest growth in Chinese imports. I argued theoretically, and provided reduced-form evidence, that this was possible through firms’ reorganization toward less exposed output industries, in which the US had a comparative advantage relative to China. In these output industries, firms expanded skilled employment by taking advantage of falling production costs due to increased offshoring to China.
The evidence provided in this paper indicate that the employment losses at the establishment level, measured by the previous papers (Acemoglu et al., 2016; Autor et al., 2013), were compensated by the employment gains that resulted from two sources. First, within-firm reorganization allowed US manufacutring firms to escape the negative impact of the China shock; US manufacturing firms reorganized their activities in many dimensions in response to the China shock. On the one hand, they reorganized their US activity from exposed to non-exposed US output markets. On the other hand, they reorganized their input sourcing as they replaced domestic suppliers with foreign suppliers and increased foreign direct investment. Second, employment at US manufacturing firms expanded in response to the combined effect of increased Chinese imports in US output and input markets. This is because increased imports in the input markets put downward pressure on US manufacturing firms’ cost of sourcing material inputs. Thus, the China shock to the firm’s input markets acted as a favorable cost shock that compensated for some or all of the negative impacts of the increased output market competition.
All of these suggest that the China shock impacted US manufacturing employment in a more nuanced way than simply increasing output market competition at the establishment level, which captures only the losses that resulted from the shock. Reorganization at the firm level and the combined effects of input and ouput market shocks can lead to net job creation. However, this may not involve the same workers in the same industries, in the same regions of the US or the same establishments of the firm (pg. 51).
When one considers the other benefits of trade, it becomes increasingly clear that globalization is not the demon it has been made out to be.
When people publicly rage about perceived injustices that don’t affect them personally, we tend to assume this expression is rooted in altruism—a “disinterested and selfless concern for the well-being of others.” But new research suggests that professing such third-party concern—what social scientists refer to as “moral outrage”—is often a function of self-interest, wielded to assuage feelings of personal culpability for societal harms or reinforce (to the self and others) one’s own status as a Very Good Person.
…To test this guilt-to-outrage-to-moral-reaffirmation premise, Rothschild and Keefer conducted five separate studies assessing the relationships between anger, empathy, identity, individual and collective guilt, self perception, and the expression of moral outrage.
Their findings?:
Triggering feelings of personal culpability for a problem increases moral outrage at a third-party target.
The more guilt over one’s own potential complicity, the more desire “to punish a third-party through increased moral outrage at that target.”
Having the opportunity to express outrage at a third-party decreased guilt in people threatened through “ingroup immorality.”
“The opportunity to express moral outrage at corporate harm-doers” inflated participants perception of personal morality.
Guilt-induced moral outrage was lessened when people could assert their goodness through alternative means, “even in an unrelated context.”
The article concludes,
These findings held true even accounting for things such as respondents political ideology, general affect, and background feelings about the issues.
Ultimately, the results of Rothschild and Keefer’s five studies were “consistent with recent research showing that outgroup-directed moral outrage can be elicited in response to perceived threats to the ingroup’s moral status,” write the authors. The findings also suggest that “outrage driven by moral identity concerns serves to compensate for the threat of personal or collective immorality” and the cognitive dissonance that it might elicit, and expose a “link between guilt and self-serving expressions of outrage that reflect a kind of ‘moral hypocrisy,’ or at least a non-moral form of anger with a moral facade.”
I’m reminded of something economist Deirdre McCloskey wrote: “You sit down with a cup of dark coffee and a nice croissant to read the New York Times, venting daily your hatred of the cruelties recorded there, and as a result are yourself saved, regardless of whether policies of “protection” advocated in its pages do the poor and tortured any actual good.”[ref]Bourgeois Dignity: Why Economics Can’t Explain the Modern World (Chicago: University of Chicago Press, 2010), 428-429.[/ref]
I’ve posted before about McKinsey’s findings regarding digital globalization. They reported,
Data flows directly accounted for $2.2 trillion, or nearly one-third, of [globalization’s] effect [in a decade]—more than foreign direct investment. In their indirect role enabling other types of cross-border exchanges, they added $2.8 trillion to the world economy. These combined effects of data flows on GDP exceeded the impact of global trade in goods.
This in turn supported research by economist Andreas Bergh, who found that
the poverty-decreasing effect of globalization is bigger in countries where institutions are worse. The graph below shows how the marginal effect of information flows on poverty varies depending on the level of bureaucratic quality. The slope looks the same for all institutional indicators, suggesting that globalization is especially important for the poor in countries with high corruption levels and inefficient public sectors.
A new Harvard working paper supports these findings, suggesting that communication networks and social interactions are more important than institutions. The authors explain,
Telling institutional versus socio-technological interpretations apart has been challenging. This paper tests these two hypotheses by measuring convergence in income across Colombian municipalities along two distinct geospatial divisions: one institutional, one socio-technological. The institutional explanation would emphasize the role that belonging to a particular departamento, or state, has on the institutional arrangements and the provision of public goods, thus affecting the incentive structure of agents to operate with better technology.
Although Colombia is a unitary republic, not a federation, states have significant autonomy1 . Studies on Colombia, including those that take an institutional perspective such as Acemoglu et al (2015)…utilize state-level data, as do almost all studies of intra-national unconditional convergence worldwide. Under the institutional assumption, a municipality should tend to converge to the income of the state to which it belongs.
The socio-technological explanation would predict that municipal income convergence should occur within the cluster of municipalities that interact intensely with each other, whether or not they belong to the same state. This is due to the need for intensive social interactions for knowhow to diffuse. To form these socio-technological groupings, we utilize a unique dataset of cellphone calls to group municipalities so that most of the phone calls happen within rather than between these clusters. To facilitate comparison with the 32 states of the institutional state aggregation, we group municipalities into 32 communication clusters…Thus, communication clusters are groups of municipalities that are densely connected through phone calls, meaning that they are significantly more likely to call members of the cluster than they are to call other municipalities(pgs. 4-5).
The authors conclude,
To test these two interpretations in a more direct way, we use municipal level data for Colombia, which we aggregate using two different grouping criteria: the departamento or state to capture institutional variation; and the communication cluster to which a municipality belongs, to capture the intensity of social interaction. We use formal wages per capita as our measure of income per capita, as it can be measured at the municipal level. We use cellphone data to group municipalities into communication clusters of intense interaction.
In this setting, we find evidence of absolute convergence in Colombia at the municipal level. We find evidence that the process is accelerated when the municipality belongs to a richer communication cluster. However, we do not find evidence of a positive influence of belonging to a richer state. We interpret these results as evidence in favor of the idea that obstacles to technology diffusion may be related to the fact that the use of technology requires tacit knowledge which tends to move slowly between brains through a protracted process of imitation and repetition as occurs in learning by doing. Within communications clusters, there seems to be accelerated convergence. Obstacles to convergence in developing countries may be related to the paucity of social interactions between citizens of the same country
…From a policy perspective, the findings emphasize the fact that economic convergence requires intense social interaction, not just the presence of institutions of a certain quality. Regions that are formally part of the same nation-state but do not really interact with the more advanced parts of the country cannot expect to share similar development outcomes.(pg. 19).
Everyyear, economist Mark Perry draws on Census Bureau reports to paint of picture of the demographics of inequality. Looking at 2015 data, he constructed the following table:
Household demographics, including the average number of earners per household and the marital status, age, and education of householders are all very highly correlated with household income. Specifically, high-income households have a greater average number of income-earners than households in lower-income quintiles, and individuals in high income households are far more likely than individuals in low-income households to be well-educated, married, working full-time, and in their prime earning years. In contrast, individuals in lower-income households are far more likely than their counterparts in higher-income households to be less-educated, working part-time, either very young (under 35 years) or very old (over 65 years), and living in single-parent households.
The good news is that the key demographic factors that explain differences in household income are not fixed over our lifetimes and are largely under our control (e.g. staying in school and graduating, getting and staying married, etc.), which means that individuals and households are not destined to remain in a single income quintile forever. Fortunately, studies that track people over time indicate that individuals and households move up and down the income quintiles over their lifetimes, as the key demographic variables highlighted above change, see C[arpe] D[iem] posts here, here and here.
What can we do to get the business and research communities together, and to establish the sorts of long-standing trusting relationships that can lead to longitudinal studies in which data is gathered using the same instruments over the course of several years and many companies, while various interventions are tested? This is the holy grail of business ethics research.


