Walker joined Difficult Run as an editor in August 2013.
He graduated from the University of North Texas with an MBA in Strategic Management and a BBA in Organizational Behavior and Human Resource Management. He's currently a grad student in Government at Johns Hopkins University. He has been published in SquareTwo, BYU Studies Quarterly, Dialogue, Graziadio Business Review, and Economic Affairs. He also contributed to Julie Smith's (ed.) 'As Iron Sharpens Iron: Listening to the Various Voices of Scripture'. His other online writing can be found at Worlds Without End and Times & Seasons. He lives in Denton, Texas, with his wife.
The Washington Post has a recent article that highlights the preferences of non-voters:
The data…makes another point very clear: Those who didn’t vote are as responsible for the outcome of the election as those who did. As we noted shortly after the election, about 30 percent of Americans were eligible to vote but decided not to, a higher percentage than the portion of the country who voted for either Trump or his Democratic opponent, Hillary Clinton. Pew’s data shows that almost half of the nonvoters were nonwhite and two-thirds were under age 50. More than half of those who didn’t vote earned less than $30,000 a year; more than half of those who did vote were over age 50.
The piece goes through several demographics:
Race: “Black and Hispanic voters voted much more heavily Democratic than white votes backed Trump, but they turned out less.”
Age: “People under 30 preferred Clinton by 30 points but made up much more of the nonvoter population than the population that actually voted. A third of nonvoters were under 30; only 1 in 8 voters was in that age group.”
Income: “Poorer whites and nonwhites generally made up more of the nonvoter pool than the voter pool.”
Education: “College graduates leaned toward Clinton — but whites without college degrees voted heavily for Trump. Nonwhites without a college education were 40 percent of the nonvoter pool and only 1 in 5 actual voters.”
Religion: “Evangelicals were the most strongly pro-Trump of the religious groups of voters, and they represented more of the voting pool than the nonvoting pool. Black Protestants and Hispanic Catholics made up less of the voting population than the nonvoting population — and strongly preferred Clinton.”
All together, the voter/nonvoter political divide looks like this:
The article concludes, “Demographic groups that preferred Trump were three times as likely to be a bigger part of the voter pool than nonvoters. Among groups that preferred Clinton, they were about 50 percent more likely to be a bigger part of the nonvoting community. Clinton nonetheless won the popular vote. But an increased turnout of under-30 voters in, say, Wisconsin, Pennsylvania and Michigan could easily have changed the results of the history.”
This fits with previous data: non-voters are a largely younger, poorer, uneducated, racially diverse group that lean left.
Political scientist Sheri Berman has an excellent piece in The Guardian that covers some of the most relevant social science on identity politics and its implications:
Rather than being directly translated into behavior, psychologists tell us beliefs can remain latent until “triggered”. In a fascinating study, Karen Stenner shows in The Authoritarian Dynamic that while some individuals have “predispositions” towards intolerance, these predispositions require an external stimulus to be transformed into actions. Or, as another scholar puts it: “It’s as though some people have a button on their foreheads, and when the button is pushed, they suddenly become intensely focused on defending their in-group … But when they perceive no such threat, their behavior is not unusually intolerant. So the key is to understand what pushes that button.”
What pushes that button, Stenner and others find, is group-based threats. In experiments researchers easily shift individuals from indifference, even modest tolerance, to aggressive defenses of their own group by exposing them to such threats. Maureen Craig and Jennifer Richeson, for example, found that simply making white Americans aware that they would soon be a minority increased their propensity to favor their own group and become wary of those outside it. (Similar effects were found among Canadians. Indeed, although this tendency is most dangerous among whites since they are the most powerful group in western societies, researchers have consistently found such propensities in all groups.)
Building on such research, Diana Mutz recently argued that Trump’s stress on themes like growing immigration, the power of minorities and the rise of China highlighted status threats and fears particularly among whites without a college education, prompting a “defensive reaction” that was the most important factor in his election. This “defensive reaction” also explains why Trump’s post-election racist, xenophobic and sexist statements and reversal of traditional Republican positions on trade and other issues have helped him – they keep threats to whites front and center, provoking anger, fear and a strong desire to protect their own group.
Understanding why Trump found it easy to trigger these reactions requires examining broader changes in American society. In an excellent new book, Uncivil Agreement, Lilliana Mason analyzes perhaps the most important of these: a decades-long process of “social sorting”. Mason notes that although racial and religious animosity has been present throughout American history, only recently has it lined up neatly along partisan lines. In the past, the Republican and Democratic parties attracted supporters with different racial, religious, ideological and regional identities, but gradually Republicans became the party of white, evangelical, conservative and rural voters, while the Democrats became associated with non-whites, non-evangelical, liberal and metropolitan voters.
This lining up of identities dramatically changes electoral stakes: previously if your party lost, other parts of your identity were not threatened, but today losing is also a blow to your racial, religious, regional and ideological identity. (Mason cites a study showing that in the week following Obama’s 2012 election, Republicans felt sadder than American parents after the Newtown school shooting or Bostonians after the Boston Marathon bombing.) This social sorting has led partisans of both parties to engage in negative stereotyping and even demonization. (One study found less support for “out-group” marriage among partisan Republicans and Democrats than for interracial marriage among Americans overall.)
Once the other party becomes an enemy rather than an opponent, winning becomes more important than the common good and compromise becomes an anathema. Such situations also promote emotional rather than rational evaluations of policies and evidence. Making matters worse, social scientists consistently find that the most committed partisans, those who are the angriest and have the most negative feelings towards out-groups, are the most politically engaged.
She continues, pointing out that
research suggests that calling people racist when they do not see themselves that way is counterproductive. As noted above, while there surely are true bigots, studies show that not all those who exhibit intolerant behavior harbor extreme racial animus. Moreover, as Stanford psychologist Alana Conner notes, if the goal is to diminish intolerance “telling people they’re racist, sexist and xenophobic is going to get you exactly nowhere. It’s such a threatening message. One of the things we know from social psychology is when people feel threatened, they can’t change, they can’t listen.”
This has obvious implications for recent debates about civility. Incivility is central to Trump’s strategy – it helps him galvanize his supporters by reminding them how “bad” and “threatening” the other side is. Since this has become such a hot-button topic on the left, it is worth being clear what incivility is. There is no definition of democracy that does not accept peaceful protest and other forms of vociferous political engagement. Incivility is about form – not substance; it is consistently defined by scholars as including invective, ridicule, emotionality, histrionics and other forms of personal attacks or norm-defying behavior. By engaging in even superficially similar tactics, Democrats abet Trump’s ability to do this – as one Trump supporter put it, every time Democrats attack him “it makes me angry, which causes me to want to defend him more” – potentially alienate wavering Republican-leaning independents, and help divert debate from policies, corruption and other substantive issues.
Over the long term of course the goal is repairing democracy and diminishing intolerance and for this promoting cross-cutting cleavages within civil society and political organizations is absolutely necessary. (Here, recent debates about ideological diversity and the new grassroots activism within the Democratic party is relevant.) Scholars have long recognized the necessity of cross-cutting cleavages to healthy democracy. In his classic study, the Social Requisites of Democracy, Seymour Martin Lipset, for example, noted that “the available evidence suggests that the chances for stable democracy are enhanced to the extent that groups and individuals have a number of cross-cutting, politically relevant affiliations”.
More specifically, research has linked cross-cutting cleavages with toleration, moderation and conflict prevention. This too has implications for contemporary debates about “identity politics”. Perhaps ironically, identity politics is a both more powerful and efficacious for Republicans (and rightwing populists more generally) than it is for Democrats, since the former are more homogeneous.
…In addition, Americans are more divided socially than they are on the issues; there is significant agreement even on controversial topics like abortion, gun control, immigration and economic policy. Promoting cross-cutting cleavages and diminishing social divisions might therefore help productive policymaking actually occur.
Things to consider the next time you feel the itch to promote or debate party politics.
A particularly interesting aspect of public attitudes toward immigration is that of political ignorance. Multiple studies have shown that political ignorance is rampant among average voters, and this holds true when it comes to immigration policy. As legal scholar Ilya Somin explains, “Immigration restriction . . . is one that has long-standing associations with political ignorance. In both the United States and Europe,survey data suggest that it is strongly correlated with overestimation of the proportion of immigrants in the population, lack of sophistication in making judgments about the economic costs and benefits of immigration, and general xenophobic attitudes toward foreigners. By contrast, studies show that there is little correlation between opposition to immigration and exposure to labor market competition from recent immigrants.” One pair of economists found that those voting to leave the European Union in the Brexit referendum, who were motivated largely by a desire to restrict immigration, “were overwhelmingly more likely to live in areas with very low levels of migration.” Similarly, voters who supported Donald Trump during the US election were more likely to oppose liberalizing immigration laws (even compared to other Republicans), but least likely to live in racially diverse neighborhoods. In short, both political ignorance and lack of interaction with foreigners tend to inflame anti-immigration sentiments. These sentiments are what George Mason University economist Bryan Caplan refers to as antiforeign bias: “a tendency to underestimate the economic benefits of interaction with foreigners.” In fact, economists take nearly the opposite view from the general public on immigration (pgs. 80-82).
In short, ignorance and fear of the unknown or “the other” (which ends up manifesting as racial resentment) lead to anti-immigration sentiments. Many have been quick to point out that economic anxieties didnot play a significant role in the rise of Trump. Cultural values, for example, played a far more significant role. Evidence from Belgium also suggests that declinism–a negative view of the state and evolution of society–is far more important in predicting populist support than economic insecurities. Nonetheless, there is some evidence that economic downturns and uncertainty do lead to a rise in populism, particularly in Europe.[ref]Check out Rudiger Dornbusch and Sebastian Edwards’ “The Macroeconomics of Populism.”[/ref] Increases in unemployment following the Great Recession eroded trust in mainstream political parties in Europe and led to a rise in support for populist parties. Harvard’s Dani Rodrik has made a case that economic globalization helped create a populist political backlash. A 2016 study looked at the political results of financial crises from 1870 to 2014. The authors conclude,
The evidence we uncover shows that financial crises put a strain on modern democracies. The typical political reaction is as follows: votes for far-right parties increase strongly, government majorities shrink, the fractionalization of parliaments rises and the overall number of parties represented in parliament jumps. These developments likely hinder crisis resolution and contribute to political gridlock. The resulting policy uncertainty may contribute to the much debated slow economic recoveries from financial crises. Financial crises are politically disruptive, even when compared to other economic crises. Indeed, we find no (or only slight) political effects of normal recessions and different responses in severe crises not involving a financial crash. In the latter, right wing votes do not increase as strongly and people rally behind the government. In the light of modern history, political radicalization, declining government majorities and increasing street protests appear to be the hallmark of financial crises. As a consequence, regulators and central bankers carry a big responsibility for political stability when overseeing financial markets. Preventing financial crises also means reducing the probability of a political disaster (pg. 245).
that financial crises of the past 30 years have been a catalyst of rightwing populist politics. Many of the now-prominent right-wing populist parties in Europe, such as the Lega Nord in Italy, the Alternative for Germany, the Norwegian Progress Party or the Finn’s Party are “children of financial crises”, having made their breakthrough in national politics in the years following a financial crash. We also find that the 2008 crisis triggered a wave of governments in which right-wing populists gained power, often as a coalition partner. As discussed, the crisis is just one of many potential factors explaining the recent successes of right-wing populism in Europe and beyond. Other drivers such as “cultural backlash”, the impact of globalization, rising inequality, and the refugee crisis of 2015 surely played a critical role too. However, “the rise of the right” in Europe since 2008 cannot be fully understood without considering the impact of the 2008 and 2011/2012 financial crises…A first potential explanation is that financial crises are perceived as inexcusable events that result from a failure of policies and regulation, rather than from an external shock. This leads to distrust in government and mainstream politics. Secondly, financial crises typically trigger creditor-debtor conflicts (Mian et al. 2014) and a rise in income and wealth inequality (Atkinson and Morelli 2010, 2011) to levels not observed in normal recessions. Thirdly, we know that financial crashes often involve large-scale bank bailouts and these are highly controversial and unpopular (e.g., Broz 2005). Such bail-out initiatives give traction to extremist ideas at the political fringe. In this environment of distrust, uncertainty and dissatisfaction, right-wing populists have learned to gain votes by offering seemingly simple solutions to complex problems, and by attributing blame to minorities or foreigners (pg. 8).
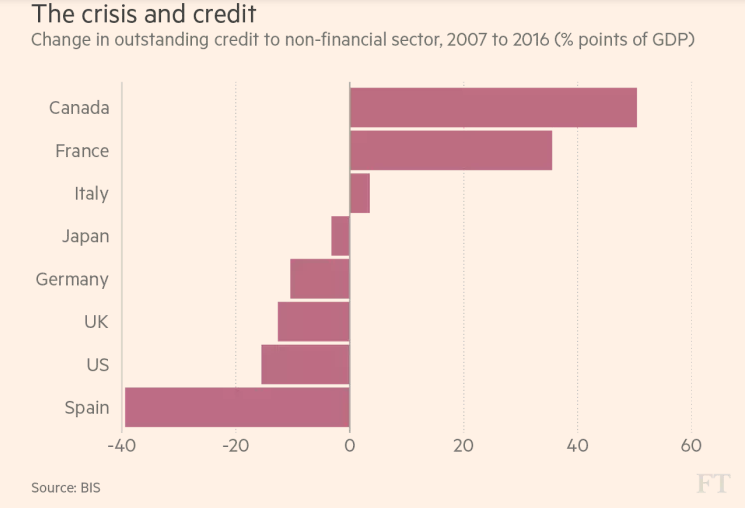
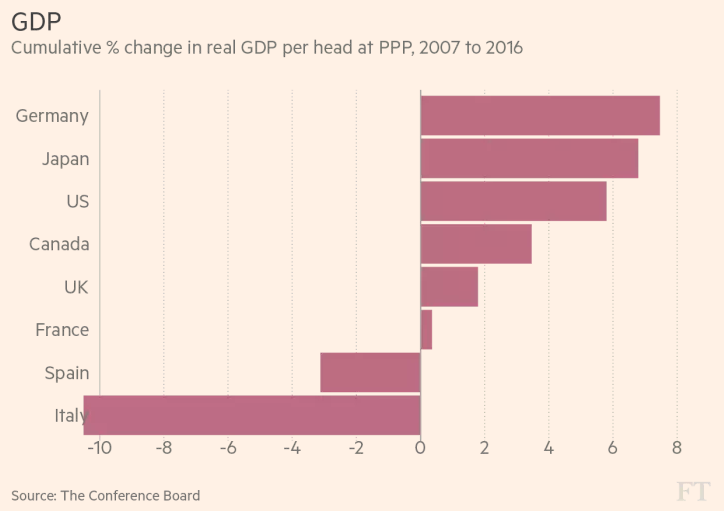
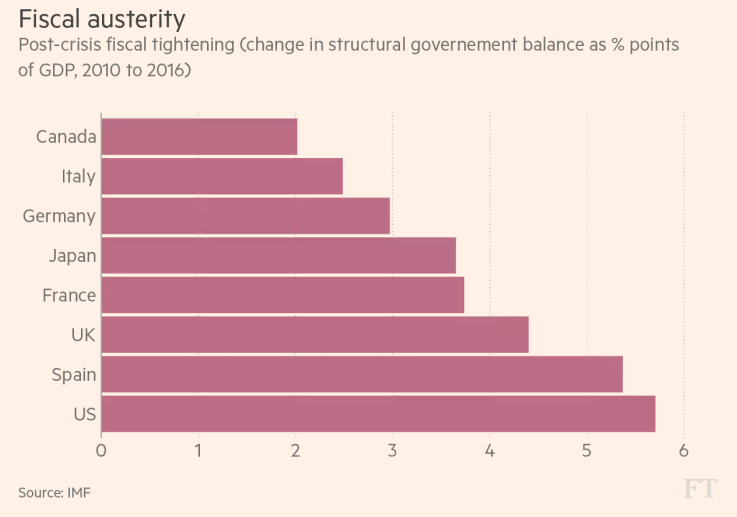
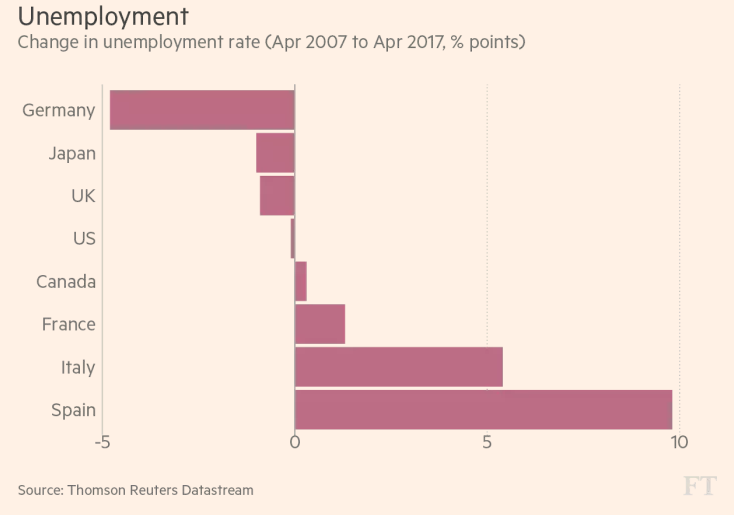
These findings fit with Martin Wolf’s observations in the FinancialTimes, which lay populism at the feet of “the financial crisis and consequent economic shocks. These not only had huge costs. They also damaged confidence in — and so the legitimacy of — financial and policymaking elites. These emperors turned out to be naked.” Using “unemployment, fiscal austerity, real incomes per head and private sector credit” as “indicators of post-crisis developments,” Wolf determines, “The four most adversely affected of these economies in the long term were (in order) Italy, Spain, the UK and US. Post-crisis, the most adversely affected were Spain, the US, Italy and the UK. Germany was the least affected by the crisis, with Canada and Japan close to it. It is not surprising, then, that Canada, Germany and Japan have been largely immune to the post-crisis surge in populism, while the US, UK, Italy and Spain have been less so, though the latter two have contained it relatively successfully.”
A more recent study supports these insights, “examin[ing] the role of the 2007–9 global financial crisis and its metastasis in Europe on voting and political beliefs in 220 subnational regions of 26 European countries.” It finds
a strong correlation between rising regional unemployment and voting for non-mainstream and especially populist parties. A one percentage point increase in unemployment is associated with a one percentage point increase in the populist vote. The association is especially strong in the south, where voters turn mostly to radical-left parties. In the north increases in regional unemployment are correlated with a rise in far-right party vote. This pattern is also present in eastern Europe, where people are moving towards xenophobic, anti-European parties. These associations do not necessarily imply causality. To advance on causality we associate voting patterns to the component of changes in unemployment stemming from the pre-crisis share of construction (which is strongly related to falling unemployment pre-2007 and rising unemployment post-2008). This approach also yields a strong correlation between the recent rise of the populist vote and industrial specialization–driven unemployment. We then examine the role of the crisis on the Brexit vote across the UK’s 379 electoral districts. In line with the European-wide results, [the data] show that the increases in regional unemployment before the referendum (2007–15) are strong predictors of the Brexit vote, while the level of unemployment is not much related to Brexit. We then study the evolution of trust, political beliefs and attitudes before and after the 2007–10 crisis and examine whether swings in unemployment are related to changing ideology. We use individual-level data on Europeans’ beliefs and attitudes from the European Social Survey that covers the period 2000–2014. [The data] show that increases in regional unemployment have resulted in a deterioration of trust towards national and European political institutions.
All of this suggests what Wolf stated: “Economic and cultural phenomena are interrelated.”
I’m once again behind on my book reviews, so here’s a list of the books I’ve read recently, their descriptions, and accompanying videos.
Valerie M. Hudson, Bonnie Ballif-Spanvill, Mary Caprioli, Chad Emmett, Sex & World Peace (Columbia University Press, 2012): “Sex and World Peace unsettles a variety of assumptions in political and security discourse, demonstrating that the security of women is a vital factor in the security of the state and its incidence of conflict and war. The authors compare micro-level gender violence and macro-level state peacefulness in global settings, supporting their findings with detailed analyses and color maps. Harnessing an immense amount of data, they call attention to discrepancies between national laws protecting women and the enforcement of those laws, and they note the adverse effects on state security of abnormal sex ratios favoring males, the practice of polygamy, and inequitable realities in family law, among other gendered aggressions. The authors find that the treatment of women informs human interaction at all levels of society. Their research challenges conventional definitions of security and democracy and shows that the treatment of gender, played out on the world stage, informs the true clash of civilizations. In terms of resolving these injustices, the authors examine top-down and bottom-up approaches to healing wounds of violence against women, as well as ways to rectify inequalities in family law and the lack of parity in decision-making councils. Emphasizing the importance of an R2PW, or state responsibility to protect women, they mount a solid campaign against women’s systemic insecurity, which effectively unravels the security of all” (Amazon).
Eric Nelson, The Hebrew Republic: Jewish Sources and the Transformation of European Political Thought (Harvard University Press, 2010): “According to a commonplace narrative, the rise of modern political thought in the West resulted from secularization—the exclusion of religious arguments from political discourse. But in this pathbreaking work Eric Nelson argues that this familiar story is wrong. Instead, he contends, political thought in early-modern Europe became less, not more, secular with time, and it was the Christian encounter with Hebrew sources that provoked this radical transformation. During the sixteenth and seventeenth centuries, Christian scholars began to regard the Hebrew Bible as a political constitution designed by God for the children of Israel. Newly available rabbinic materials became authoritative guides to the institutions and practices of the perfect republic. This thinking resulted in a sweeping reorientation of political commitments. In the book’s central chapters Nelson identifies three transformative claims introduced into European political theory by the Hebrew revival: the argument that republics are the only legitimate regimes; the idea that the state should coercively maintain an egalitarian distribution of property; and the belief that a godly republic would tolerate religious diversity. One major consequence of Nelson’s work is that the revolutionary politics of John Milton, James Harrington, and Thomas Hobbes appear in a brand-new light. Nelson demonstrates that central features of modern political thought emerged from an attempt to emulate a constitution designed by God. This paradox, a reminder that while we may live in a secular age, we owe our politics to an age of religious fervor, in turn illuminates fault lines in contemporary political discourse” (Amazon).
Hans Rosling with Ola Rosling and Anna Rosling Ronnlund, Factfulness: Ten Reasons We’re Wrong About the World–and Why Things Are Better Than You Think (Flatiron Books, 2018): “When asked simple questions about global trends―what percentage of the world’s population live in poverty; why the world’s population is increasing; how many girls finish school―we systematically get the answers wrong. So wrong that a chimpanzee choosing answers at random will consistently outguess teachers, journalists, Nobel laureates, and investment bankers. In Factfulness, Professor of International Health and global TED phenomenon Hans Rosling, together with his two long-time collaborators, Anna and Ola, offers a radical new explanation of why this happens. They reveal the ten instincts that distort our perspective―from our tendency to divide the world into two camps (usually some version of us and them) to the way we consume media (where fear rules) to how we perceive progress (believing that most things are getting worse). Our problem is that we don’t know what we don’t know, and even our guesses are informed by unconscious and predictable biases. It turns out that the world, for all its imperfections, is in a much better state than we might think. That doesn’t mean there aren’t real concerns. But when we worry about everything all the time instead of embracing a worldview based on facts, we can lose our ability to focus on the things that threaten us most. Inspiring and revelatory, filled with lively anecdotes and moving stories, Factfulness is an urgent and essential book that will change the way you see the world and empower you to respond to the crises and opportunities of the future” (Amazon).
N.T. Wright, Paul: A Biography (HarperOne, 2018): “In this definitive biography, renowned Bible scholar, Anglican bishop, and bestselling author N. T. Wright offers a radical look at the apostle Paul, illuminating the humanity and remarkable achievements of this intellectual who invented Christian theology—transforming a faith and changing the world. For centuries, Paul, the apostle who “saw the light on the Road to Damascus” and made a miraculous conversion from zealous Pharisee persecutor to devoted follower of Christ, has been one of the church’s most widely cited saints. While his influence on Christianity has been profound, N. T. Wright argues that Bible scholars and pastors have focused so much attention on Paul’s letters and theology that they have too often overlooked the essence of the man’s life and the extreme unlikelihood of what he achieved. To Wright, “The problem is that Paul is central to any understanding of earliest Christianity, yet Paul was a Jew; for many generations Christians of all kinds have struggled to put this together.” Wright contends that our knowledge of Paul and appreciation for his legacy cannot be complete without an understanding of his Jewish heritage. Giving us a thoughtful, in-depth exploration of the human and intellectual drama that shaped Paul, Wright provides greater clarity of the apostle’s writings, thoughts, and ideas and helps us see them in a fresh, innovative way. Paul is a compelling modern biography that reveals the apostle’s greater role in Christian history—as an inventor of new paradigms for how we understand Jesus and what he accomplished—and celebrates his stature as one of the most effective and influential intellectuals in human history” (Amazon).
Gregory A. Boyd, Cross Vision: How the Crucifixion of Jesus Makes Sense of Old Testament Violence (Fortress Press, 2017): “The Old Testament God of wrath and violence versus the New Testament God of love and peace it’s a difference that has troubled Christians since the first century. Now, with the sensitivity of a pastor and the intellect of a theologian, Gregory A. Boyd proposes the “cruciform hermeneutic,” a way to read the Old Testament portraits of God through the lens of Jesus’ crucifixion. In Cross Vision, Boyd follows up on his epic and groundbreaking study, The Crucifixion of the Warrior God. He shows how the death and resurrection of Jesus reframes the troubling violence of the Old Testament, how all of Scripture reveals God’s self-sacrificial love, and, most importantly, how we can follow Jesus’ example of peace” (Amazon).
Although past research suggests authoritarianism may be a uniquely right-wing phenomenon, the present two studies tested the hypothesis that authoritarianism exists in both right-wing and left-wing contexts in essentially equal degrees. Across two studies, university (n 5 475) and Mechanical Turk (n 5 298) participants completed either the RWA (right-wing authoritarianism) scale or a newly developed (and parallel) LWA (left-wing authoritarianism) scale. Participants further completed measurements of ideology and three domain-specific scales: prejudice, dogmatism, and attitude strength. Findings from both studies lend support to an authoritarianism symmetry hypothesis: Significant positive correlations emerged between LWA and measurements of liberalism, prejudice, dogmatism, and attitude strength. These results largely paralleled those correlating RWA with identical conservative-focused measurements, and an overall effect-size measurement showed LWA was similarly related to those constructs (compared to RWA) in both Study 1 and Study 2. Taken together, these studies provide evidence that LWA may be a viable construct in ordinary U.S. samples.
Or as the body of the text states,
Taken as a whole, these results suggest that left-wing authoritarianism may prove to be a viable construct in ordinary U.S. samples. Not only did LWA show a significant correlation with liberalism in both a sample of U.S. college students and a separate nationwide sample of U.S. citizens, it also showed overwhelmingly significant correlations with dogmatism, prejudice, and attitude strength. In each case, these relationships paralleled similar relationships between RWA and those constructs—and the overall average effect sizes in both studies were very similar for LWA and RWA. Further, the present results demonstrate that the presence of LWA cannot be attributed to a correlational sleight of hand: Analyses of mean patterns in both studies for liberals and conservatives clearly indicate as much (and indeed, slightly more) LWA on the left than RWA on the right. In short, these results suggest that LWA may in fact be alive and well in ordinary U.S. samples (pg. 15).
This new study reminds me of an article posted by Monica on Facebook on how social psychology misunderstands conservatives (and, consequently, liberals as well):[ref]Check out her other post here on Difficult Run on the same subject.[/ref]
The [Rigidity of the Right] model posits, as one summary puts it, that “a constellation of psychological attributes and evocable states — including dogmatism, closed-mindedness, intolerance of ambiguity, preference for order and structure, aversion to novelty and stimulation, valuing of conformity and obedience, and relatively strong concern with threat — leads to a preference for right-wing over left-wing political ideology.”
…[A] team led by NYU’s John Jost, a political psychologist, published an important meta-analysis that took a big, sweeping look at decades of prior work on this subject and concluded that, according to the available evidence, “The core ideology of conservatism stresses resistance to change and justification of inequality and is motivated by needs that vary situationally and dispositionally to manage uncertainty and threat.”
According to a chapter in the book The Politics of Social Psychology by the researchers Ariel Malka, Yphtach Lelkes, and Nissan Holzer and published last year, Jost et al.’s meta-analysis effectively resuscitated the rigidity of the right model after a “number of years” in which it “received sporadic attention.” As a result, critiques of the model began bubbling up, too — even as it captured a great deal of mainstream attention. The authors of the chapter are three of the more ardent critics of the model, and they lay out a number of potential flaws with it.
One of their strongest arguments concerns poorly constructed psychological instruments that don’t actually measure what they claim to measure. As they explain, “Scales treated as indicators of conservative vs. liberal ideology often contain content pertaining to religious sentiment, cognitive rigidity, orientation toward authority, and/or intolerance, in addition to (mostly cultural) political content.” That is, these scales in a sense assume that conservatives are more rigid or authoritarian or whatever else — the very thing they are used to test.
…In a paper published in Political Psychology in 2015, they reported on the results of a clever study in which they had respondents fill out either a version of the original scale, a version modified to tap liberal sentiments, or a version modified to tap conservative sentiments. In the original scale, for example, one of the items was: “A group which tolerates too much difference of opinion among its own members cannot exist for long.” In one tweaked version, the word religious was inserted before group; in the other, the word environmental was inserted instead.
As it turned out, these tweaks affected which group responded more “dogmatically” a great deal. Liberals scored as more dogmatic than conservatives when it came to their agreement with sentiments like “When it comes to stopping global warming, it is better to be a dead hero than a live coward” and “A person who thinks primarily of his/her own happiness, and in so doing disregards the health of the environment (for example, trees and other animals), is beneath contempt,” while conservatives, by contrast, scored higher than liberals on items tuned in the opposite political direction. (In fact, there was little difference between how conservatives scored on the original scale and the tweaked-to-be-more-explicitly-conservative version, lending credence to the claim that the original scale was biased in a direction that captured more conservative than liberal dogmatism.) “By making only small adjustments to a popularly used dogmatism scale, results show that liberals can be significantly more dogmatic if a liberal domain is made salient,” explained the authors.
These scales, in short, are all too often structured in a way in which respondents’ tendencies toward dogmatism or close-mindedness or intolerance are ascertained by asking them about issues that are politicized. And while social and political psychologists have sometimes asked about rigidity in ways designed to tap liberal ideas — the famed authoritarianism researcher Bob Altemeyer, for example, did publish a left-wing authoritarianism scale — this has been the exception rather than the norm.
Why this asymmetry? The Malka team carefully states early in its chapter that “[W]e make no claim that ideological bias plays a role” in any of the rigidity of the right model’s shortcomings, and that they “leave that as a matter for other scholars to debate.” But one obvious possibility that other social psychologists have raised, in both this context and others, is that certain weaknesses in the field flow from how ideologically slanted it is: Within social psychology, there is something like a 14-to-1 ratio in favor of liberal-identifying researchers relative to conservative-identifying ones. Even if you’re not broadly sympathetic to the idea that liberal bias in academia is a major problem — and I certainly view that claim as overstated — 14-to-1 is, well, a big gap. That’s how blind spots creep in — that’s how you keeping gauging study subjects’ “sensitivity to threat” by asking them about crime or terrorism, but rarely about climate change or right-wing police violence, and then “discover” that conservatives are more sensitive to threat. “This sort of ‘soft bias’ can be really hard to spot if most or all researchers have the same ideological outlook because it is built into people’s ideologically guided beliefs about reality,” said Yoel Inbar, a psychology researcher at the University of Toronto and a co-author of a key paper that revealed the ideological tilt within social and personality psychology. “Worrying about the threats your side cares about seems entirely well-founded and reasonable, worrying about those the other side cares about demands an explanation.”
The problem is that, if Malka and other critics of the prevailing social-psychological view of conservatism are correct, these soft biases have built up within the field and generated important misconceptions and, in some cases, overgeneralizations about the differences between liberals and conservatives.
One of the most potentially important examples is intolerance. According to the rigidity of the right model, conservatives are more intolerant than liberals. But in a Current Directions in Psychological Science article published in 2014, a team led by Mark J. Brandt of Tilburg University in the Netherlands poked and prodded that idea — and found that it toppled fairly quickly.
Nations don’t trade with each other. We speak as if they do out of habit and convenience, but it’s not true. The United States and Canada are not competing firms. America doesn’t buy steel from China, and China doesn’t buy soybeans from America. Rather, hundreds of individual American companies choose to buy steel from Chinese mills and fabricators, and hundreds of Chinese-owned firms make deals to buy soybeans from far-flung American growers. Unlike wars, which really are fought by nation against nation, international trade occurs among countless sellers and buyers, all acting independently in their own best interest.
Tariffs don’t punish countries. They punish innumerable consumers, wholesalers, importers, exporters, farmers, manufacturers — the myriad discrete actors whose choices and preferences are the true substance of international trade. To those individuals, national trade deficits and surpluses are irrelevant. They aren’t competing — they’re cooperating. Buyers and sellers aren’t in conflict with each other, let alone with each other’s countries.
On the contrary: By doing business together, traders create wealth and connections, knitting the world together in mutual interest, making the planet more harmonious.
Trade war is an insidious term. The metaphor notwithstanding, trade isn’t war. It’s peace.
He’s absolutely right. From my paper currently under review at Economic Affairs:
Using data from the World Bank’s Doing Business rankings and the EFW Index, Michael Strong (2009) finds a close connection between peace, economic liberalization, and business-friendly environments. As a case study, Strong looks to Northern Ireland between 1975 and 2000, determining that the increased economic freedom, the consequential economic boom, and the decrease in violence were interconnected…Using a data set of 243,225 country-pair observations from 1950 to 2000, Lee and Pyun (2016) find that the probability of interstate military conflict is reduced with an increase in bilateral trade interdependence and global trade openness. However, proximity matters, seeing that bilateral trade has a greater peace-promoting effect for neighboring countries, while global trade openness has a greater effect on more distant countries. After analyzing data spanning from 1970 to 2005, De Soysa and Fjelde (2010) find that higher economic freedom lowers the risk of civil war. This corresponds with a later study by De Soysa and Flaten (2012), which finds that higher levels of globalization (particularly economic globalization) reduce the risk of civil war as well as state violations of human rights. Other research finds that free-market conditions and economic liberalization are associated with lower levels of various societal insecurities, including open armed conflict, violent crime, murder, societal militarization and political instability (Stringham & Levendis, 2010; Bjornskov, 2015; De Soysa, 2011, 2016).
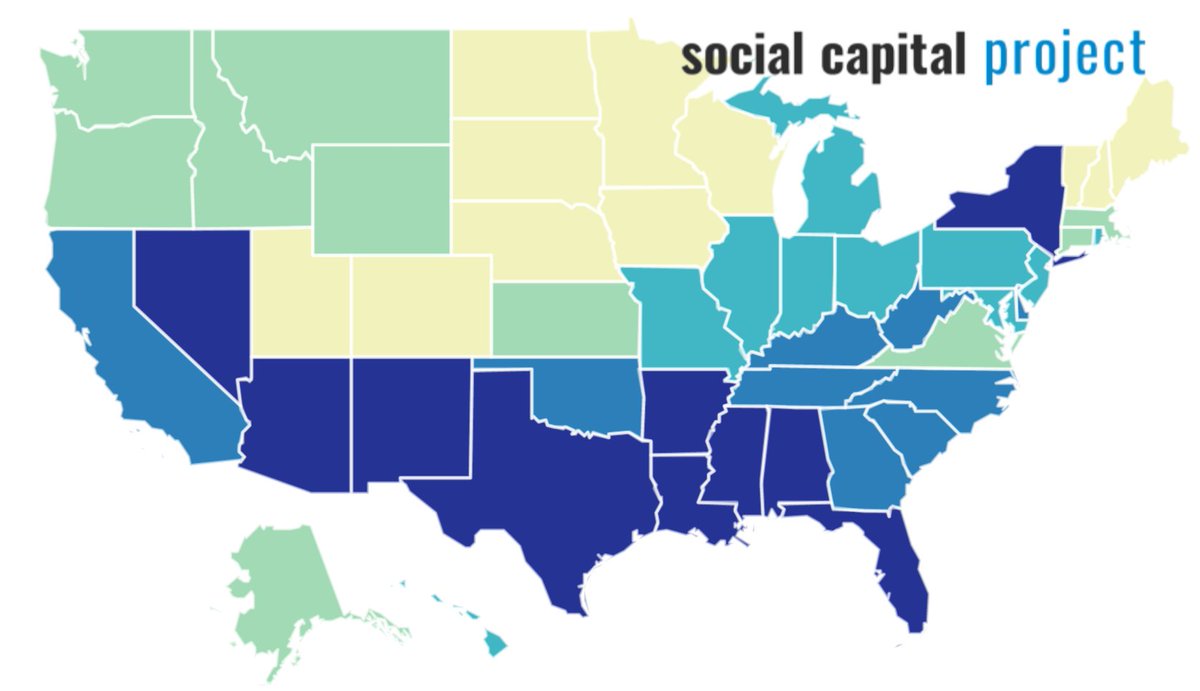
Last year, Senator Mike Lee launched The Social Capital Project, described as “a multi-year research effort that will investigate the evolving nature, quality, and importance of our associational life. “Associational life” is our shorthand for the web of social relationships through which we pursue joint endeavors—namely, our families, our communities, our workplaces, and our religious congregations. These institutions are critical to forming our character and capacities, providing us with meaning and purpose, and for addressing the many challenges we face.” The initiative has released several reports, whose findings I will highlight below:
Between 1975 and 2011, the share of three- and four-year-olds cared for by a parent during the day declined from 80 percent to somewhere between 24 and 48 percent. But parents are spending no less time with their children overall.
Between 1973 and 2016, the percentage of Americans age 18-64 who lived with a relative declined from 92 percent to 79 percent. The decline was driven by a dramatic 21-point drop in the percentage who were living with a spouse, from 71 percent to 50 percent.
In 1970, there were 76.5 marriages per 1,000 unmarried women aged 15 and older. As of 2015, that rate had declined by more than half to 32 per thousand.
In 1970, 56 percent of American families included at least one child, but by 2016 just 42 percent did. The average family with children had 2.3 children in 1970 but just 1.9 in 2016. Among all families—with or without children—the average number of children per family has dropped from 1.3 to 0.8.
Between 1970 and 2016, the share of children being raised by a single parent (or by neither parent) rose from 15 percent to 31 percent.
Between 1970 and 2015, births to single mothers rose from 11 percent of all births to 40 percent.
In the early 1970s, nearly seven in ten adults in America were still members of a church or synagogue. While fewer Americans attended religious service regularly, 50 to 57 percent did so at least once per month. Today, just 55 percent of adults are members of a church or synagogue, while just 42 to 44 percent attend religious service at least monthly.
In the early 1970s, 98 percent of adults had been raised in a religion, and just 5 percent reported no religious preference. Today, however, the share of adults who report having been raised in a religion is down to 91 percent, and 18 to 22 percent of adults report no religious preference.
In 1973, two-thirds of adults had “quite a lot” or “a great deal” of confidence in “the church or organized religion,” and in another survey the same year, 36 percent reported “a great deal” of confidence in organized religion. By 2016, those numbers had fallen to 41 percent and 20 percent, respectively.
Between 1974 and 2016, the percent of adults who said they spend a social evening with a neighbor at least several times a week fell from 30 percent to 19 percent.
Between 1970 and the early 2010s, the share of families in large metropolitan areas who lived in middle-income neighborhoods declined from 65 percent to 40 percent. Over that same time period the share of families living in poor neighborhoods rose from 19 percent to 30 percent, and those living in affluent neighborhoods rose from 17 percent to 30 percent.
Between 1972 and 2016, the share of adults who thought most people could be trusted declined from 46 percent to 31 percent. Between 1974 and 2016, the number of Americans expressing a great deal or fair amount of trust in the judgement of the American people “under our democratic system about the issues facing our country” fell from 83 percent to 56 percent.
Between 1974 and 2015, the share of adults that did any volunteering who reported volunteering for at least 100 hours increased from 28 percent to 34 percent.
Between 1972 and 2012, the share of the voting-age population that was registered to vote fell from 72 percent to 65 percent, and the trend was similar for the nonpresidential election years of 1974 and 2014. Correspondingly, between 1972 and 2012, voting rates fell from 63 percent to 57 percent (and fell from 1974 to 2014).
Between 1972 and 2008, the share of people saying they follow “what’s going on in government and public affairs” declined from 36 percent to 26 percent.
Between 1972 and 2012, the share of Americans who tried to persuade someone else to vote a particular way increased from 32 percent to 40 percent.
Between the mid-1970s and 2012, the average amount of time Americans between the ages of 25 and 54 spent with their coworkers outside the workplace fell from about two-and-a-half hours to just under one hour.
The share of workers living and working in different counties was 26 percent in 1970 and 27 percent in the second half of the 2000s, and commuting time has risen only modestly since 1980.
Between the mid-1970s and 2012, among 25- to 54-year-olds, time at work rose 4 percent. The story was very different for men and women though. Hours at work rose 27 percent among women. Among men, hours at work fell by 9 percent between the mid-1970s and 2012.
Work has become rarer, in particular, among men with less education. From the mid-1970s to 2012, hours at work fell by just 2 percent among men with a college degree or an advanced degree, compared with 14 percent among those with no more than a high school education.
Between 1995 and 2015, workers in “alternative work arrangements” (e.g., temp jobs, independent contracting, etc.) grew from 9 percent to 16 percent of the workforce.
Since 2004, median job tenure has been higher than its 1973 level, indicating that workers are staying in their jobs longer than in the past.
Between 1970 and 2015, union membership declined from about 27 percent to 11 percent of all wage and salary workers.
Nonmarital sexual activity has risen substantially since the mid-twentieth century. The share of teen-age women who are sexually active, for example, is 2.5 times higher today than in the early 1960s. Increasing use of reliable contraception has mitigated the effect on unwed childbearing. Over the same period, the share of women having used contraception the first time they had sex outside marriage more than doubled. But while marital pregnancy rates have fallen in half as a result of the contraceptive revolution, because of higher rates of sexual activity, improper contraceptive use, and the increasing acceptability of unwed childbearing, nonmarital pregnancy rates are over one-third higher than in the early 1960s.
As for abortion, pregnant women—married or single—are less likely to obtain an abortion than they were before the Roe v. Wade decision. That decline also reflects the declining stigma around unwed childbearing and a drop in unintended pregnancy. Since at least the early 1980s, a rising share of births from nonmarital pregnancies are from pregnancies that were intentional; today, half of births from nonmarital pregnancies are intended.
Three times as many births today are from unwed pregnancies than in the early 1960s, and only 9 percent of these pregnancies are followed by a shotgun marriage—down from 43 percent in the early 1960s.
We trace these trends to the rising affluence of the mid-twentieth century, when a greater prioritization of nonmaterial needs (especially among women, who saw greatly expanded opportunities) met a rising ability to fulfill them. The effect of affluence was felt in the discovery of penicillin (which dramatically reduced the incidence of syphilis); the introduction of the pill (which expanded women’s opportunities by allowing them to control their fertility); the development and increasing affordability of labor-saving home appliances, processed food, and paid child care (which gave women the opportunity to work longer hours outside the home, raising the opportunity cost of childbearing); and the nation’s expansion of a safety net for single mothers (facilitating childbearing without marriage among more disadvantaged women). Rising affluence is an undeniably beneficial development that we should not want to reverse, but it has also led to less stable family circumstances for an increasing number of children.
The top fifth of states, in terms of social capital scores, are home to just nine percent of Americans, while 29 percent live in bottom-fifth states.
We have social capital scores for 2,992 of 3,142 counties, containing 99.7 percent of the American population. Just eight percent of Americans live in the top fifth of these counties, while 39 percent of the population lives in the bottom fifth of counties. Nearly six in ten (59 percent) of Americans live in the bottom two fifths of counties, compared with 24 percent living in the top two fifths.
The 12 states with the highest social capital scores are distributed across two continuous blocs: nine states running from Utah, through Wyoming and Colorado, across the Dakotas and Nebraska, and over to Iowa, Minnesota, and Wisconsin; and the three Northern New England states of Maine, New Hampshire, and Vermont. These states tend to rank highly across all seven subindices as well. Utah has the highest social capital score, followed by Minnesota and Wisconsin.
Of the 11 states with the lowest levels of social capital, ten of them fall within a contiguous bloc of states running from Nevada, across the Southwest and South over to Georgia and Florida. New York is the only state in the bottom 11 that is outside this group. Louisiana has the lowest social capital score, followed by Nevada, Arizona, and New Mexico.
Of the nine states ranked just above this bottom group, seven border and extend the southern bloc, filling out most of the rest of the South. The 17 southern states in the bottom 20 are home to 45 percent of Americans and 74 percent of Americans in bottom-fifth counties. Six in ten (59 percent) of people in the 17 states live in bottom-fifth counties. Only 17 of 1,338 counties in these states are in the top fifth.
Our indices are not dominated by any single subindex, and our state and county indices appear to be approximating social capital in the same general way.
Among the component variables underlying the state index, the strongest associations with the index itself across states were for the volunteer rate (0.86), heavy television watching by children (-0.81), the share of adults who made charitable contributions (0.80), the share with emotional and social support (0.80), heavy usage of electronics among children (-0.77), the share of adults that are married (0.75), the share of children living with a single parent (-0.72), and the share of births that were to unwed mothers (-0.71).
At the county level, the highest correlates of social capital were violent crime (-0.73), the share of children with a single parent (-0.71), the share of adults currently married (0.69), voting rates (0.59), and nonprofits plus congregations (0.57).
Despite the outsized role that religious communities have played in social capital investment, indicators of religious adherence and commitment were generally weakly (or even negatively) correlated with our social capital scores, both at the state and county levels. This may suggest that social capital organized around religion may be displaced by secular sources of social capital, that the availability of resources provided by secular social capital weakens religious commitment, or that people in distressed places turn to religious communities for the support that is missing in other parts of their lives. This question is a subject for future Social Capital Project research.
Our social capital indices correlate strongly with earlier social capital indices across states and counties, and with other indices such as the Family Prosperity Institute’s Family Prosperity Index, Opportunity Nation’s Opportunity Index, and the Economic Innovation Group’s Distressed Communities Index.
We show the correlations of our indices and subindices with 59 state-level and 50 county-level benchmarks reflecting a range of economic, social, demographic, educational, health, and other outcomes.
Our index is a clear improvement on the Penn State index, based on this benchmarking, but remarkably, Robert Putnam’s state index from Bowling Alone, published nearly two decades ago, has slightly higher benchmark correlations than ours. Because our index captures the health of family life, and because it is based on up-to-date and freely available data (including at the county level), we still prefer it to the Putnam measure. The fact that the correlation between the two state-level indices is 0.81 reassuringly suggests that very different approaches to social capital measurement capture the same essential construct.
Considerable recent research has focused on changes in income inequality within countries [Atkinson, Piketty, and Saez 2011; Alvaredo et al. 2013; Saez and Zucman 2016; Assouad, Chancel, and Morgan 2018; Novokmet et al. 2018]. There is substantial variation in income inequality within countries. Income inequality after taxes and transfers is relatively low in Canada, Japan and most western European countries and quite high in Brazil, Egypt, India, Mexico, and South Africa [Solt 2016]. Moreover, within-country income inequality has increased in recent decades in several large economies, including China, Russia, and the United States [Assouad, Chancel, and Morgan 2018].
Recent scholarly research has also addressed cross-country and worldwide income inequality [Bourguignon and Morrisson 2002; Sala-i-Martin 2006; Hellebrandt and Mauro 2015; Milanovic 2013; Bourguignon 2015; Milanovic 2016]. This article makes three major contributions to the literature on global income inequality. First, development as a process is integrated into the analysis of income inequality. Researchers have generally ignored the impact of the development process on demographic changes and income inequality. Changes in demographic factors as countries move through different phases of the development process will be examined and their impact on economic growth and income inequality analyzed. Second, Gini coefficient measures are developed for cross-country income inequality from 1820 to 2015 and for each of the three types of income inequality for 1960 to 2015. Third, the impact of development as a process and changes in other factors that influence economic growth, are used to project future changes in income inequality.
During 1960-2000, demographic changes accompanying the development process contributed to the sizeable increases in cross-country and worldwide income inequality. However, beginning in the 1990s, changing demographic factors accompanying the development process led to a reversal of this situation. Increasingly, developing countries have moved into phases of development associated with high rates of economic growth, while the high-income countries have moved into a development phase that results in slower growth. As a result, there has been a dramatic reduction in income inequality during 2000-2015. Moreover, it is a virtual certainty that the demographic factors underlying the recent reductions in inequality will continue for at least a couple more decades, leading to further reductions in global income inequality (pg. 2-3).
In an interview, Nobel economist Angus Deaton noted, “I both love inequality and am terrified of it. Inequality is partly a marker of success, so that if someone thinks of something, some new innovation that benefits us all, and the market works properly, they get richly rewarded for that. And that’s just terrific. And that creates inequality. So some of the greatest inequalities in the world have come from the greatest successes.” This seems to fit with the phases of development discussed above.
In November 2017, Oxford University Press published The Captured Economy: How the Powerful Enrich Themselves, Slow Down Growth, and Increase Inequality. Coauthored by Niskanen Center scholars Brink Lindsey and Steven M. Teles, The Captured Economy argues that systematic breakdowns in democratic governance have allowed wealthy special interests to capture broad domains of the policymaking process and twist the rules for their own benefit. Steadily worsening “upward redistribution” via “regressive regulation” has contributed significantly to the American economy’s twin woes of stagnating growth and sky-high inequality.
This website builds on and expands the analysis provided in The Captured Economy. In the book, Lindsey and Teles briefly examined four broad policy areas that showcase the problem of regressive regulation: financial regulation, intellectual property protection, occupational licensing, and land-use regulation. They admitted, though, that space constraints permitted them to cover “only the tip of the iceberg.” This website is dedicating to explore the phenomenon in all its murky depths.
We begin by focusing on the four policy areas covered in the book, but over time we plan to include additional, related policy and issue areas. For each covered area, capturedeconomy.com will serve as a comprehensive repository of analysis and news, including not only academic research and journalistic analysis but also the latest news on policy developments. Our goal is to make capturedeconomy.com an indispensable resource for journalists, policymakers, and concerned citizens interested in better understanding and remedying the deep structural problems that afflict American policymaking and economic performance.
Anthropologist and cultural psychologist Joseph Henrich has defined our peculiar subset of the world population as WEIRD: Western, Educated, Industrialized, Rich, Democratic. How did this psychological variation arise? A new working paper offers a very interesting answer:
A growing body of research suggests that populations around the globe vary substantially along several important psychological dimensions, and that people from societies characterized as Western, Educated, Industrialized, Rich and Democratic (WEIRD) are particularly unusual (1–6). Often at the extremes of global distributions, people from WEIRD populations tend to be more individualistic, independent, analytically-minded and impersonally prosocial (e.g., trusting strangers) while revealing less conformity, obedience, in-group loyalty and nepotism (3, 5–13). While these patterns are now well documented, efforts to explain this variation from a cultural evolutionary and historical perspective have just begun (13–20). Here, we develop and test a cultural evolutionary theory that aims to explain a substantial portion of this psychological variation, both within and across nations. Not only does our approach contribute to explaining global variation and address why WEIRD societies so often occupy the tail ends of global distributions, but it also helps explain the psychological variation within Europe—among countries, across regions within countries and between individuals with different cultural backgrounds within the same country and region.
Our approach integrates three insights. The first, drawing on anthropology, reveals that the institutions built around kinship and marriage vary greatly across societies (21–23) and that much of this variation developed as societies scaled up in size and complexity, especially after the origins of food production 12,000 years ago (22, 24–29). In forging the tightly-knit communities needed to defend agricultural fields and pastures, cultural evolution gradually wove together social norms governing marriage, post-marital residence and in-group identity (descent), leading to a diversity of kin-based institutions, including the organizational forms known as clans, lineages and kindreds (21, 27, 30). The second insight, based on work in psychology, is that people’s motivations, emotions, perceptions, thinking styles and other aspects of cognition are heavily influenced by the social norms, social networks, technologies and linguistic worlds they encounter while growing up (31–38). In particular, with intensive kin-based institutions, people’s psychological processes adapt to the collectivistic demands and the dense social networks that they interweave (39–43). Intensive kinship norms reward greater conformity, obedience, holistic/relational awareness and in-group loyalty but discourage individualism, independence and analytical thinking (41, 44). Since the sociality of intensive kinship is based on people’s interpersonal embeddedness, adapting to these institutions tends to reduce people’s inclinations towards impartiality, universal (non-relational) moral principles and impersonal trust, fairness and cooperation. Finally, based on historical evidence, the third insight suggests that the branch of Western Christianity that eventually evolved into the Roman Catholic Church—hereafter, ‘the Western Church’ or simply ‘the Church’—systematically undermined the intensive kin-based institutions of Europe during the Middle Ages (45–52). The Church’s marriage policies and prohibitions, which we will call the Marriage and Family Program (MFP), meant that by 1500 CE, and likely centuries earlier in some regions, Europe lacked strong kin-based institutions, and was instead dominated by relatively weak, independent and isolated nuclear or stem families (49–51, 53–56). This made people exposed to Western Christendom rather unlike nearly all other populations.
Integrating these insights, we propose that the spread of the Church, specifically through its transformation of kinship and marriage, was a key factor behind a cultural shift towards a WEIRDer psychology in Europe. This shift eventually fostered the creation of new formal institutions, including representative governments, individual rights, commercial law and impersonal markets (17, 57). This theory predicts that (1) societies with less intensive kin-based institutions should have a WEIRDer psychology and (2) historical exposure to the Church’s MFP should predict both less intensive kin-based institutions and, as a consequence, a WEIRDer psychology.
To illuminate these relationships for diverse populations, we (1) developed measures of the intensity of kin-based institutions, (2) created historical databases to estimate the exposure of populations to the Church (along with the MFP) and (3) compiled 20 different psychological outcomes, including laboratory experiments, validated scales, survey questions and ecologically-valid observational data. We examine the predicted relationships from three complementary perspectives. Across countries, we can observe the broadest range of variation in the largest number of psychological outcomes. Across regions, we can track the historical Church as it lumbered across Europe and detect its footprints on the psychological patterns and marital arrangements of modern Europeans. Finally, by comparing second-generation immigrants in Europe based on their links to the kin-based institutions of their ancestral communities around the world, we eliminate many alternative hypotheses for the relationships we’ve illuminated.


 Valerie M. Hudson, Bonnie Ballif-Spanvill, Mary Caprioli, Chad Emmett, Sex & World Peace (Columbia University Press, 2012): “Sex and World Peace unsettles a variety of assumptions in political and security discourse, demonstrating that the security of women is a vital factor in the security of the state and its incidence of conflict and war. The authors compare micro-level gender violence and macro-level state peacefulness in global settings, supporting their findings with detailed analyses and color maps. Harnessing an immense amount of data, they call attention to discrepancies between national laws protecting women and the enforcement of those laws, and they note the adverse effects on state security of abnormal sex ratios favoring males, the practice of polygamy, and inequitable realities in family law, among other gendered aggressions. The authors find that the treatment of women informs human interaction at all levels of society. Their research challenges conventional definitions of security and democracy and shows that the treatment of gender, played out on the world stage, informs the true clash of civilizations. In terms of resolving these injustices, the authors examine top-down and bottom-up approaches to healing wounds of violence against women, as well as ways to rectify inequalities in family law and the lack of parity in decision-making councils. Emphasizing the importance of an R2PW, or state responsibility to protect women, they mount a solid campaign against women’s systemic insecurity, which effectively unravels the security of all” (
 Eric Nelson, The Hebrew Republic: Jewish Sources and the Transformation of European Political Thought (Harvard University Press, 2010): “According to a commonplace narrative, the rise of modern political thought in the West resulted from secularization—the exclusion of religious arguments from political discourse. But in this pathbreaking work Eric Nelson argues that this familiar story is wrong. Instead, he contends, political thought in early-modern Europe became less, not more, secular with time, and it was the Christian encounter with Hebrew sources that provoked this radical transformation. During the sixteenth and seventeenth centuries, Christian scholars began to regard the Hebrew Bible as a political constitution designed by God for the children of Israel. Newly available rabbinic materials became authoritative guides to the institutions and practices of the perfect republic. This thinking resulted in a sweeping reorientation of political commitments. In the book’s central chapters Nelson identifies three transformative claims introduced into European political theory by the Hebrew revival: the argument that republics are the only legitimate regimes; the idea that the state should coercively maintain an egalitarian distribution of property; and the belief that a godly republic would tolerate religious diversity. One major consequence of Nelson’s work is that the revolutionary politics of John Milton, James Harrington, and Thomas Hobbes appear in a brand-new light. Nelson demonstrates that central features of modern political thought emerged from an attempt to emulate a constitution designed by God. This paradox, a reminder that while we may live in a secular age, we owe our politics to an age of religious fervor, in turn illuminates fault lines in contemporary political discourse” (
 Hans Rosling with Ola Rosling and Anna Rosling Ronnlund, Factfulness: Ten Reasons We’re Wrong About the World–and Why Things Are Better Than You Think (Flatiron Books, 2018): “When asked simple questions about global trends―what percentage of the world’s population live in poverty; why the world’s population is increasing; how many girls finish school―we systematically get the answers wrong. So wrong that a chimpanzee choosing answers at random will consistently outguess teachers, journalists, Nobel laureates, and investment bankers. In Factfulness, Professor of International Health and global TED phenomenon Hans Rosling, together with his two long-time collaborators, Anna and Ola, offers a radical new explanation of why this happens. They reveal the ten instincts that distort our perspective―from our tendency to divide the world into two camps (usually some version of us and them) to the way we consume media (where fear rules) to how we perceive progress (believing that most things are getting worse). Our problem is that we don’t know what we don’t know, and even our guesses are informed by unconscious and predictable biases. It turns out that the world, for all its imperfections, is in a much better state than we might think. That doesn’t mean there aren’t real concerns. But when we worry about everything all the time instead of embracing a worldview based on facts, we can lose our ability to focus on the things that threaten us most. Inspiring and revelatory, filled with lively anecdotes and moving stories, Factfulness is an urgent and essential book that will change the way you see the world and empower you to respond to the crises and opportunities of the future” (
 N.T. Wright, Paul: A Biography (HarperOne, 2018): “In this definitive biography, renowned Bible scholar, Anglican bishop, and bestselling author N. T. Wright offers a radical look at the apostle Paul, illuminating the humanity and remarkable achievements of this intellectual who invented Christian theology—transforming a faith and changing the world. For centuries, Paul, the apostle who “saw the light on the Road to Damascus” and made a miraculous conversion from zealous Pharisee persecutor to devoted follower of Christ, has been one of the church’s most widely cited saints. While his influence on Christianity has been profound, N. T. Wright argues that Bible scholars and pastors have focused so much attention on Paul’s letters and theology that they have too often overlooked the essence of the man’s life and the extreme unlikelihood of what he achieved. To Wright, “The problem is that Paul is central to any understanding of earliest Christianity, yet Paul was a Jew; for many generations Christians of all kinds have struggled to put this together.” Wright contends that our knowledge of Paul and appreciation for his legacy cannot be complete without an understanding of his Jewish heritage. Giving us a thoughtful, in-depth exploration of the human and intellectual drama that shaped Paul, Wright provides greater clarity of the apostle’s writings, thoughts, and ideas and helps us see them in a fresh, innovative way. Paul is a compelling modern biography that reveals the apostle’s greater role in Christian history—as an inventor of new paradigms for how we understand Jesus and what he accomplished—and celebrates his stature as one of the most effective and influential intellectuals in human history” (
 Gregory A. Boyd, Cross Vision: How the Crucifixion of Jesus Makes Sense of Old Testament Violence (Fortress Press, 2017): “The Old Testament God of wrath and violence versus the New Testament God of love and peace it’s a difference that has troubled Christians since the first century. Now, with the sensitivity of a pastor and the intellect of a theologian, Gregory A. Boyd proposes the “cruciform hermeneutic,” a way to read the Old Testament portraits of God through the lens of Jesus’ crucifixion. In Cross Vision, Boyd follows up on his epic and groundbreaking study, The Crucifixion of the Warrior God. He shows how the death and resurrection of Jesus reframes the troubling violence of the Old Testament, how all of Scripture reveals God’s self-sacrificial love, and, most importantly, how we can follow Jesus’ example of peace” (


 In November 2017, Oxford University Press published