The Gender Pay Gap Revisited

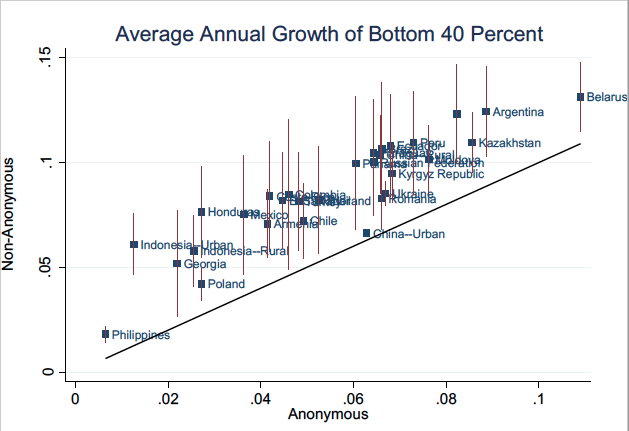
I’ve written about the gender wage gap before and a recent piece in The Economist on the subject graced my news feed the other day:

In the rich and middle-income countries that make up the OECD, the median wage of a woman working full-time is 85% that of a man. This is not, as many assume, because employers pay a woman less than they would have paid a man in her place. Data from 25 countries collected by Korn Ferry, a consultancy, show that women earn 98% as much as men who do the same job for the same employer. The real reason is twofold. Women outnumber men in positions with lower salaries and little chance of promotion. And men and women are segregated between occupations and industries; those where women predominate pay less.

Just a fifth of senior executives in G7 countries are female. Across the European Union supervisors are more likely to be male, even when most of their underlings are female. Nearly 70% of working women in the EU are in occupations where at least 60% of workers are female. The top four jobs done by American women—teacher, nurse, secretary and health aide—are all at least 80% female.

Occupations dominated by women have lower status and pay. Primary teachers in the OECD earn 81% of the average for graduate jobs. Nurses earn less than police officers; cleaners less than caretakers. Women’s lower earnings mean that after divorcing or being widowed, they often end up poor. And skewed workforces can be a problem for firms—and for society. BHP Billiton, a mining company, has found that sites with more women are run more safely. Heavily male police forces and female nursing corps are unlikely to have the best mix of skills, experience and priorities to deal with crime victims and patients of the opposite sex. One theory for why boys do worse than girls in school is the shortage of male academic role models.

The gender pay gap would shrink if men moved into female-dominated jobs and vice versa. But in America such workplace gender integration stalled about a decade ago after steadily increasing for more than two decades. A study of 12 European countries concluded that between 1995 and 2010 the share of female workers in most occupations changed little. A similar pattern has been found in Australia.

Furthermore,

a survey by McKinsey in 2016 found that women in corporate America asked at the same rate as men. It also found that women and men were promoted at similar rates, except at the lowest rungs of the career ladder, where women lagged behind. A possible reason is that managers are reluctant to promote women who are starting families, or are likely to do so soon.

…A survey earlier this year of America, Australia, Britain, France, Germany and Scandinavian countries by The Economist and YouGov, a pollster, gauged how children affected working hours. Of women with children at home, 44-75% had scaled back after becoming mothers, by working fewer hours or switching to a less demanding job, such as one requiring less travel or overtime. Only 13-37% of fathers said they had done so, of whom more than half said their partner had also scaled back.

When women give priority to caring for toddlers they fall behind. A recent American study put the motherhood penalty—the average by which women’s future wages fall—at 4% per child, and 10% for the highest-earning, most skilled white women. A British mother’s wages fall by 2% for each year she is out of the workforce, and by 4% if she has good school-leaving qualifications. Jennifer Young, an American mother with a degree in mechanical engineering, had been out of the workforce for 13 years when Cummins, an engineering firm, offered her a re-entry internship in engineering last year. She had been sure that a part-time or administrative job was her only possible route back to work.

Lots of good info. Check it out.

Vaping: The Safer Alternative

Another example of perfect being the enemy of the good and good intentions paving away:

Image result for vaping gifFlavor bans for e-cigarettes and menthol in combustibles are pressing policy issues that have received relatively little empirical study. Now that the FDA has the power to regulate flavors in both combustible and e-cigarettes, it has again been considering flavor bans for all types of cigarettes (FDA, 2017). Thus, there is an urgent need for an analysis of the impact of flavor bans on public health. Despite the need for this information, there are no studies predicting the impacts of alternative bans on the use of combustibles, e-cigarettes, and neither. We provide such information for adult smokers and recent quitters using a DCE and a large, nationally representative survey.

We find that flavors themselves serve as an attribute that drives choices across combustibles and e-cigarettes and choosing none. We conclude that flavor bans can be effective levers that affect smokers’ choices. Alternative flavor bans can either enhance protection of the health of the public or worsen it. Specifically, our results indicate that banning flavors in e-cigarettes, while allowing them to remain in combustibles, would result in the greatest increase in smoking of combustible cigarettes; and the use of e-cigarettes would decline (10.3 percent).

By comparison, we find that a ban on menthol combustible cigarettes would produce the greatest reduction (4.8 percent) in the use of combustible cigarettes across the flavor bans that we study. Much of this movement from combustible cigarettes would be to e-cigarettes (3.5 percent) and the remainder would be toward “none” (1.3 percent). Given that combustible cigarettes impose the most significant harms on those who smoke them, reducing the smoking rate would likely increase the health of the public. Our results suggest that policymakers need to consider simultaneously the impact of flavor policies on combustibles, e-cigarettes, and abstinence (pgs. 20-21).

One study found for “those aged 15 years and above in 2016, almost 6.6 million fewer premature deaths and 86.7 million fewer LYL due to cigarette use occur in the Optimistic Scenario. The average 15-year-old would increase their life expectancy by 0.5 years, reflecting the increased life span of those who have, or would otherwise have smoked cigarettes, switching to e-cigarettes.” Even in the Pessimistic Scenario, “a net gain of 1.6 million (1.4 million male; 0.3 million female) representing 6% fewer premature deaths and 20.8 million (17.8 million male; 3.0 million female) representing 8% fewer LYL are projected. Average life expectancy increases 0.08 years (0.14 male; 0.02 female).”[ref]E-cigarettes have also reduced smoking in Europe.[/ref]

While I’d prefer that people not smoke at all, I’m all for safer alternatives that reduce premature deaths.

Image result for gandalf vaping gif

Chinese Rebirth: Art and the Economy

Above is a pic of Chinese artist Chen Zhen’s 1999 sculpture Precipitous Parturition, which currently hangs in the Guggenheim Museum in New York City as part of its Art and China after 1989: Theater of the World exhibit. Zhen “used found materials, weaving black rubber bicycle inner tubes, plastic toy cars, and bicycle parts into a 25-meter-long writhing dragon form. Inspired by a slogan proclaiming: “In 2000, 100 million Chinese people will possess their own cars. Welcome China to participate in the competition of our car industry!,” the work comments on China’s transition from a nation of bicycles into a nation of cars.” If you look at the middle of the sculpture, you’ll see that the dragon is giving birth to an abundance of toy cars, capturing the essence of China’s emerging, globalized economy and culture.

As I listened to the background of Zhen’s art, I immediately thought of a 2001 lecture by the late Peter Drucker:

Let me start out by saying that maybe six weeks ago I had a visit from an old student. Forty years ago, he was a young Taiwanese. In the meantime, he has built a very successful business in Taiwan, and for the last seven years or so has been in Shanghai, where he is now head of a very large joint-venture firm. And I asked him, “What has happened? What’s the most important thing that has happened in China the last three to five years?” And he thought for about five seconds and then said, “That we now consider owning an automobile a necessity and not a luxury.” That is what globalization means. It is not an economic event; it’s a psychological phenomenon. It means that all of the developed West’s values–its mindset and expectations and aspirations–are seen as the norm…It is a fundamental change in expectations and values.[ref]Peter F. Drucker, Rick Wartzman (ed.), “On Globalization” in The Drucker Lectures: Essential Lessons on Management, Society, and Economy (New York: McGraw-Hill, 2010), 215.[/ref]

While Zhen may have bemoaned this modern China,[ref]It’s worth noting that even though Zhen grew up in China, he lived in France from 1986 until his death in 2000.[/ref] the country’s heightened participation in the global economy nonetheless yielded enormous benefits for the Chinese people.

Worries over increasing technology, urbanization, and globalization–and the cultural ramifications of it–are too often misplaced. Personally, I find it troubling that people pine over a lost era of poverty and misery. So instead of interpreting the toy cars in Zhen’s piece as a kind of spreading viral infection, perhaps we should see it as a rebirth; as something new and beautiful. Because that’s the only way I can think to describe millions of people being lifted out of extreme poverty.

Individualism on the Rise Worldwide

Image result for individualism gif

Reason reports,

Individualism is rising across the world, according to a forthcoming study in Psychological Science by a team of Canadian and American psychologists who evaluated 51 years of data on individualistic practices and values across 77 countries.

There is, however, one big exception to this salutary trend: China.

Researchers focused on shifts in measures like the cross-cultural Individualism-Collectivism scale in the countries they evaluated. Individualism promotes a view of self-direction and autonomy, whereas collectivism fosters conformity and adherence to social obligations. Individualistic cultures prioritize independence and uniqueness whereas collectivist cultures emphasize family and fitting in.

To get at how cultures have moved along the individualism-collectivism spectrum the researchers used data focusing on changes in individualistic cultural practices and also World Values Survey responses that track shifts in cultural values.

The relevant cultural practices included changes in household size, percentage of people living alone, older adults living alone, and divorce rates. The researchers also analyzed how values changed with regard to the importance of friends versus family; teaching children independence or obedience; and preferences for self-expression such as arguing that free speech should be protected in their countries.

So what’s causing this shift? After looking at “socioeconomic development, disaster frequency, pathogen prevalence and climate affected trends in individualism,” the researchers found that “socioeconomic development had by far the strongest effect, accounting for between 35 and 58 percent of the change in individualism…The shift toward greater individualism is not confined just to developed countries. Overall, they find a 12 percent global shift on the axis toward increased individualism. The richer people become, the more likely they are to throw off the shackles of collectivism.”

So how come China hasn’t kept up? “As a possible explanation, researchers cite a 2014 study that identified profound cultural differences between southern and northern Chinese. Specifically, the folks in rice-growing southern China are more interdependent and holistic-thinking than those who live in the more individualistic wheat-growing north. Of course, it doesn’t help that the Communist government under President Xi Jinping is forcefully suppressing dissent.”

The Global Economic Impact of Climate Change

Image result for climate change

Yale economist William Nordhaus has done some of the best research on the economic effects of climate change. In a new working paper, Nordhaus and Andrew Moffat survey the literature (27 studies) and look at 36 different estimates regarding the global economic impact of climate change by 2100. They note that the IPCC stated in their 2007 report, “Global mean losses could be 1 to 5% of GDP for 4°C of warming” (pg. 2). Overall, “there are many studies of theoretical temperature increases in the 2 to 4 °C range, and that they cluster in the range of a loss of 0 to 4% of global output” (pg. 13). The authors’ own “preferred regression” provides an “estimated impact” of “1.63 % of income at 3 °C warming and 6.53% of income at a 6 °C warming. We make a judgmental adjustment of 25% to cover unquantified sectors…With this adjustment, the estimated impact is -2.04 (+ 2.21) % of income at 3 °C warming and -8.16 (+ 2.43) % of income at a 6 °C warming” (pg. 3).

This supports my previous posts about the economics of climate change. Once again, climate change will drastically reduce income over the next 100 years without intervention (and recent research suggests that we might have more time to intervene than previously thought). But people will still be be significantly better off compared to us today even if we fail to act. They just won’t be as well off as they could have been.[ref]Political philosophers Jason Brennan and Bas van der Vossen cover this in their upcoming book In Defense of Openness (Oxford University Press, forthcoming).[/ref]

Labor Protectionism: Minimum Wage and the Labor Market Effects of Immigration

Image result for immigrant labor

A new working paper provides some interesting results about the interplay between immigration and minimum wage laws:

Our first empirical strategy exploits the non-linearity of the minimum wage across U.S. States to investigate the role played by the minimum wage in shaping the impact of immigration on the wages and employment of competing native workers. We find that on average, immigration has relatively small detrimental effects on the wages and employment outcomes of competing native workers. The main contribution of this study is not to provide yet another estimate of the wage and employment responses to immigration but, rather, to investigate the role of minimum wages in determining such responses. Indeed, we show that the labor market effects of immigration are heterogeneous across U.S. States characterized by different levels of minimum wage. In particular, we find that the impact of immigration on natives’ labor market outcomes is more negative in states where the effective minimum wage is relatively low. In contrast, sufficiently high minimum wages tend to protect native workers from any adverse wage or unemployment effects of immigration.

Our second empirical methodology uses a difference-in-differences approach. We use cross-state differences in the impact of federal minimum wage adjustments on state effective minimum wages. Over our period of interest, the successive rises in the federal minimum wage have fully affected the states where the effective minimum wage is equal to the federal one (the treatment group), with no impact in high minimum wage states (the control group). Thus, we can estimate the difference between the labor market impact of immigration before and after the federal policy changes between the treatment group and the control group. Our estimates indicate that the detrimental impact of immigration on natives’ wages and employment have been mitigated thanks to the federal minimum wage increases that occurred in three installements between 2007 and 2010.

Taken together, our results indicate that high minimum wages tend to protect employed native workers against competition from immigrants. This may come at the price, obviously, of rendering access to employment more difficult for outsiders such as the unemployed natives and new immigrants, a question we cannot investigate given the limits of our data (pg. 51-52).

Interesting, but not surprising. Case in point, consider my summary of Thomas Leonard’s Illiberal Reformers:

The book meticulously demonstrates that the progressive impulse toward inflating the administrative state was driven largely by self-promotion (i.e, the professionalization of economists), racist ideologies (i.e., the fear of race suicide), and an unwavering faith in science. Not only should the “undesirables” of the gene pool be sterilized, but they should be crowded out of the labor force as well. Those considered “unfit” for the labor market included blacks, immigrants, and women. In order to artificially raise the cost of employing the “unfit,” progressives sought to implement minimum wage (often argued to be a “tariff” on immigrant labor), maximum hours, and working standard legislation.

A “tariff” on immigrant labor indeed.

The Effects of Indian Child Labor Laws

A recent working paper looks at the effects of India’s 1986 anti-child labor law. Once again, good intentions and actual outcomes are at odds with one another:

The estimated effect of the ban is to increase relative employment among children under the age of 14. Having an underage sibling leads to a 0.3 percentage point increase in the likelihood of engaging in work after the ban for the very young. While this point estimate is small, it is both statistically and economically significant; the pre-ban proportion of children employed in that age range is only 2 percent so the effect of the ban is to increase employment by 15% over the mean for this group. The ban increases the probability of employment by 0.8 percentage points (5.6% over the mean) for young children ages 10-13. However, older children ages 14-17 overall are unaffected by the ban. The effect for this group is both small relative to the mean and statistically insignificant. Again, the largest increase in child labor is in agriculture…which is consistent with the partial mobility case of the two-sector model where there is restricted entry into manufacturing (pg. 22).

The authors then look at five measures of household welfare:

  • Per capita expenditure.
  • Per capita food expenditure.
  • Caloric intake per capita.
  • Staple share of calories; i.e., “a measure of household nutritional adequacy in the presence of caloric needs that are unknown or variable across households. [The] logic is that if households attach a high disutility to having caloric intake below caloric needs, they will substitute towards the cheapest sources of calories (staples)” (pg. 25).
  • Household index asset; i.e., “a set of variables that capture the quality and quantity of housing, the type of energy used for cooking and lighting, and the quantity of electricity used (which is likely to be correlated with the number of appliances and durables used by the household” (pg. 25).

Their findings?

We find a negative and statistically significant point estimate of the ban’s effect on four out of five welfare measures. The one exception is caloric intake per capita which has a positive but not statistically significant coefficient. This is consistent with households near-subsistence – the ones likely to be most affected by the ban – being unable to cut back on calories and instead reducing other aspects of household welfare (consuming more less tasty staples or selling assets) as well as the idea that increased child labor for these households may increase household caloric requirements and thereby constrain households from adjustment on this margin. However the changes for all of the welfare measures are quantitatively small – about 0.01 standard deviations of the pre-ban cross-section – and the standard errors are small enough to rule out large positive or negative effects of the ban (pg. 26).

Nonetheless, “we take this as evidence that the ban makes these households unambiguously worse off” (pg. 5). They conclude,

This paper is the first empirical investigation of the impact of India’s most important legal action against child labor. While the Child Labor (Prohibition and Regulation) Act of 1986 prevented employers from employing children in certain sectors and increased regulation of child labor in non-family run businesses, the net result of this ban appears to be an increase in child labor in some families. We find that child wages decrease in response to such laws and poor families send out more children into the workforce. Due to increased employment, affected children are less likely to be in school. These results are consistent with a two sector model with some frictions on mobility across sectors where the ban is more stringently enforced in one sector than the other. Importantly, we also examine the overall welfare effects of the ban on households. Along various measures of household consumption and expenditure, we find that the ban leads to small decreases in household welfare.

This paper does not intend to suggest that all child labor bans are useless. In fact, well formulated and implemented bans could absolutely help in eliminating child labor; but as we do in this case, research would have to examine how a decrease in child labor affects child and household welfare (Baland and Robinson (2000); Beegle, Dehejia and Gatti (2009)). To echo the reasoning in Basu (2004): “Legal interventions, on the other hand, even when they are properly enforced so that they do diminish child labor, may or may not increase child welfare. This is one of the most important lessons that modern economics has taught us and is something that often eludes the policy maker” (pg. 30).

This isn’t all that surprising. Consider Paul Krugman:

In 1993, child workers in Bangladesh were found to be producing clothing for Wal-Mart, and Senator Tom Harkin proposed legislation banning imports from countries employing underage workers. The direct result was that Bangladeshi textile factories stopped employing children. But did the children go back to school? Did they return to happy homes? Not according to Oxfam, which found that the displaced child workers ended up in even worse jobs, or on the streets–and that a significant number were forced into prostitution.

The 1997 UNICEF State of the World’s Children report had similar findings:

The consequences for the dismissed children and their parents were not anticipated. The children may have been freed, but at the same time they were trapped in a harsh environment with no skills, little or no education, and precious few alternatives. Schools were either inaccessible, useless or costly. A series of follow-up visits by UNICEF, local non-governmental organizations (NGOs) and the International Labour Organization (ILO) discovered that children went looking for new sources of income, and found them in work such as stone-crushing, street hustling and prostitution — all of them more hazardous and exploitative than garment production. In several cases, the mothers of dismissed children had to leave their jobs in order to look after their children.

In cases like this, legislation is rarely the answer. In fact, according to economist Robert Whaples,

Most economic historians conclude that…legislation was not the primary reason for the reduction and virtual elimination of child labor between 1880 and 1940 [in the United States]. Instead they point out that industrialization and economic growth brought rising incomes, which allowed parents the luxury of keeping their children out of the work force. In addition, child labor rates have been linked to the expansion of schooling, high rates of return from education, and a decrease in the demand for child labor due to technological changes which increased the skills required in some jobs and allowed machines to take jobs previously filled by children. Moehling (1999) finds that the employment rate of 13-year olds around the beginning of the twentieth century did decline in states that enacted age minimums of 14, but so did the rates for 13-year olds not covered by the restrictions. Overall she finds that state laws are linked to only a small fraction – if any – of the decline in child labor. It may be that states experiencing declines were therefore more likely to pass legislation, which was largely symbolic.[ref]This is true of most sweatshop conditions.[/ref]

The road to hell and all that.

Image result for good intentions hell

New Draft Report Covering a Decade of Refugees

A draft report by the U.S. Department of Health and Human Services found that between 2005 and 2014, refugees brought in $63 billion more in government revenue than they cost. As reported by The New York Times,

The draft report…contradicts a central argument made by advocates of deep cuts in refugee totals as President Trump faces an Oct. 1 deadline to decide on an allowable number. The issue has sparked intense debate within his administration as opponents of the program, led by Mr. Trump’s chief policy adviser, Stephen Miller, assert that continuing to welcome refugees is too costly and raises concerns about terrorism.

Advocates of the program inside and outside the administration say refugees are a major benefit to the United States, paying more in taxes than they consume in public benefits, and filling jobs in service industries that others will not. But research documenting their fiscal upside — prepared for a report mandated by Mr. Trump in a March presidential memorandum implementing his travel ban — never made its way to the White House. Some of those proponents believe the report was suppressed.

Well, when you build an entire campaign on anti-immigration/refugee rhetoric, what else can you do?

Image result for trump shrug gif

Land-Use Restrictions and the Economy

A brand new NBER working paper confirms what past evidence has shown: land-use restrictions tend to have negative effects on the economy. The researchers conclude,

Image result for land-use restrictionsHistorically, U.S. economic growth has gone hand-in-hand with the regional reallocation of labor and capital. The pace of resource reallocation, however, has slowed considerably. This decline has roughly coincided with lower productivity and output growth, as well as growing home price premia in high income states, including California and New York.

This paper develops a theory of these observations based on land-use regulations. We analyzed how policies that restrict land-use have affected resource reallocation, aggregate output and productivity, and regional employment shares.

We constructed a multi-region model economy in which regions differ by their productivity, their amenities, their urban land stock, and land-use regulations. We develop a procedure that uses the model together with data on land acreage, regional employment shares, and regional labor productivities to identify time series of regional TFP, amenities, and to systematically construct a time series of land-use regulations, which has been missing from the literature. Our model-inferred TFP, amenities, and land-use regulations compare fairly closely with independent measures of state-level regulations and quality of life measures.

We find that reforming land-use regulations would generate substantial reallocation of labor and capital across U.S. regions, and would significantly increase investment, output, productivity, and welfare. The results indicate that too few people are located in the highly productive states of California and New York. In particular, we find that deregulating just California and New York back to their 1980 land-use regulation levels would raise aggregate productivity by as much as 7 percent and consumption by as much as 5 percent. The results suggest that relaxing land-use restrictions may contribute significantly to higher aggregate economic performance (pg. 40).

They explain “that even modest land-use deregulation leads to a substantial reallocation of population across the states, with California’s population growing substantially. We also find that economy-wide TFP, output, consumption, and investment would be significantly higher as a consequence of deregulation. We find that U.S. labor productivity would be 12.4 percent higher and consumption would be 11.9 percent higher if all U.S. states moved halfway from their current land-use regulation levels to the current Texas level. Much of these gains reflect general equilibrium effects from the policy change. In particular, roughly half of the output and welfare increases reflect the substantial reallocation of capital across states” (pg. 4).

Mobility and Growth at the Top and Bottom

“While income trends in such groups are often referred to as growth rates of the ‘rich’ or the ‘poor’,” write the authors of a new paper,

an underappreciated point is that membership in these groups is far from stable over time. When there is mobility in the income distribution, over time some of the initially poor will rise out of the bottom 40%, while others will fall from the top 60% into the bottom 40%. The same is true at the top end, with some fortunate individuals ascending into the top 10% while others drop out of this group.

This has consequences for how to interpret trends in group average incomes. For example, the policy implications, and even the political acceptability, of a given change in average income in the top 1% of the income distribution depends crucially on whether this group of top earners consists of the same people over time, or instead whether some of the initially rich fall out of the top group and are replaced with those who were initially poorer. This distinction matters just as much at the lower end of the income distribution. For example, when evaluating interventions designed to benefit those starting out at the bottom 10% of the income distribution, it is of considerable policy importance to be able to track the same group of individuals over time, and particularly to be able to track the experiences of those who were able to increase their incomes sufficiently to rise out of the bottom 10%.[ref]This has been pointed out by others using various datasets.[/ref]

The authors, in turn,

use data from the World Income and Wealth database, which is derived from published summaries of income tax records to measure average incomes and top income shares in a sample of mostly advanced economies, as well as the World Bank’s PovcalNet database, which reports data on average incomes and summary measures of inequality based on household surveys for a large number of mostly developing countries. Some of the cross-country patterns we observe in estimates of income mobility seem quite plausible given our priors. For example, among the high-income countries, the Scandinavian countries and much of Europe show relatively high levels of income persistence, while the US, Singapore, and Taiwan rank among the countries with low levels of income persistence.

To illustrate the consequences of mobility for growth rates of group average incomes for each country in our dataset, we take the latest available ten-year period and compute the conventionally available anonymous growth rate of average incomes for the top 10% (for countries in the World Income and Wealth database) and bottom 40% (for PovcalNet countries) of the income distribution. We then compare these to estimates of the corresponding non-anonymous growth rates obtained using our approach.

…In the case of the bottom 40%, the non-anonymous growth rate is considerably higher than the corresponding anonymous growth rate (the World Bank’s measure of ‘shared prosperity’). The difference is economically significant, averaging about 3% per year. This gap reflects the fact that the non-anonymous growth rate captures the experience of those who started out in the bottom 40% but had faster-than-average growth and thus rose out of the bottom 40% by the end of the period over which the growth rate is calculated. Conversely, the anonymous growth rate is lower because it reflects the experience of those who started out above the 40th percentile but had slower-than-average growth and thus fell back into the bottom 40%. Putting these observations together, this means that by tracking shared prosperity anonymously, policymakers could inadvertently overlook the success of some initially poor individuals. Or more succinctly, those who start out poor on average grow faster than you might think based on commonly reported anonymous growth rates.

The exact opposite holds true when tracking growth at the top end of the income distribution…As a result, commonly available anonymous growth rates of top incomes exaggerate the fortunes of the rich, often by a considerable margin. Or more succinctly, those who start out rich grow more slowly than you might think based on anonymous growth rates.

Important stuff.