Are Patents Slowing the Productivity of Some Firms?

According to Noah Smith, a 2015 OECD report “looked at productivity not at the global or national level, but at the corporate level. Different companies have different technologies, different management systems and different levels of talent…At a small number of companies, productivity growth hasn’t slowed at all. If you look at only these “global frontier” companies, there has been no productivity slowdown at all! This is especially true in services industries…The top performers have blazed ahead, while other companies have stagnated or even become less productive.”

Smith offers a number of possibilities for this difference, but the most interesting one revolves around patents:

[I]ntellectual property law is making it harder for companies to use ideas developed at other companies. There has been an explosion in the number of patents granted in the U.S. since the early 1980s. In Japan the increase has been even more dramatic. Some of the fastest growth has been in patents for business methods — exactly the kind of thing that ought to diffuse across companies and equalize productivity. In earlier ages, businesses could freely copy each other’s way of doing things; now, it is often illegal. 

Some level of patent protection, of course, is necessary to encourage innovation. But many economists believe that we now give out far too many patents, often for innovations of questionable originality.[ref]Economist Alex Tabarrok has criticized the mismatch between patent law and patent theory.[/ref] This is something we would expect to increase the gap between the most productive companies and the rest. 

Whatever the reason for the divergence between companies, we need to find it and fix it if we can. The divergence could be affecting a lot more than productivity. A torrent of research in the past decade suggests that much of the increase in wage inequality in developed countries is due to differences in wages between different companies — work for a good company and you get better pay, work for a bad one and you’re out of luck. Fixing the productivity divergence might help us fight inequality as well. 

Interesting stuff.
Reducing Poverty & Improving Economic Mobility

A 2015 Brookings report written for the campaign season is still relevant today. Researcher Isabel Sawhill lays out a few major ideas candidates could use to reduce poverty and improve economic mobility. Three hurdles necessary for climbing out of poverty are:

  1. Graduating high school
  2. Working full-time
  3. Delaying parenthood until they in a stable, two-parent family

Sawhill proposes a number of policies aimed at helping people achieve these objectives:

Sawhill 1118002

  • To support work, make the Child and Dependent Care Tax Credit (CDCTC) refundable and cap it at $100,000 in household income. Because the credit is currently non-refundable, low-income families receive little or no benefit, while those with incomes above $100,000 receive generous tax deductions. This proposal would make the program more equitable and facilitate low-income parents’ labor force participation, at no additional cost.
  • To strengthen families, make the most effective forms of birth control (IUDs and implants) more widely available at no cost to women, along with good counselling and a choice of all FDA-approved methods. Programs that have done this in selected cities and states have reduced unplanned pregnancies, saved money, and given women better ability to delay parenthood until they and their partners are ready to be parents. Delayed childbearing reduces poverty rates and leads to better prospects for the children in these families.

Check out the full paper.

Nobel Economist on Inequality

ANGUS DEATON | ‘Some of the enormous riches we’re seeing at the top in the U.S. today are coming from activities whose social value is in doubt.’

I found this two-year-old WSJ interview with Angus Deaton while I was combing through some saved posts. I thought it was worth highlighting. Here are a few excerpts that convey Deaton’s thoughts on inequality:

[Inequality] could [even] be people at the bottom versus people in the middle. One of the things that has happened is that at the very bottom there may actually be some squeezing up of those gaps partly because people in the middle may be being replaced by offshoring and so on. Whereas people at the bottom who are mainly in service jobs really can’t be, so they’re doing relatively well.

…I both love inequality and am terrified of it. Inequality is partly a marker of success, so that if someone thinks of something, some new innovation that benefits us all, and the market works properly, they get richly rewarded for that.

And that’s just terrific. And that creates inequality. So some of the greatest inequalities in the world have come from the greatest successes.

The terror part is—well, there are several different things. One that I worry about is that some of the enormous riches we’re seeing at the top in the United States today are coming from activities whose social value is in doubt.[ref]One of those activities could very well be cronyism. Cronyism, according to economist David Henderson, is “negative-sum. That is, in the process of redistributing wealth, cronyism destroys wealth” (pg. 7).[/ref] So some of the activities that are going on in Wall Street that are occupying some of the smartest of our young minds, it’s not entirely clear that their society really wants them to be doing that as opposed to innovating in the private sector, or curing cancer. The other thing that I worry about is the political power that comes with extreme wealth.

He also discusses some alarming findings from his most recent research:

We’ve seen mortality rates falling for the best part of 100 years, maybe even longer. When we looked at the total mortality rates for this middle-aged group from 45 to 55 and we saw they were rising—I mean, this is something that’s been falling forever.

And then about 1998 it just turns and starts going the other way. So, there’s this increase in mortality. And it’s almost entirely for white non-Hispanics. Black mortality rates are falling even faster than they’d ever been, Hispanic rates are falling on track.

The rates in middle age for all European countries are falling exactly as they have been, as they were in the U.S. up until 1998. But for this group, this middle-aged, white non-Hispanics, this mortality rate is going up. If you look at the causes of death that are most rapidly rising, it’s suicides, the biggest one is poisonings…And of course that’s what they’d call accidental overdoses. A lot of it is from prescription painkillers and a lot of it is from illegal drugs, and then a lot of it’s from alcohol.

…This is much worse among those who have a high-school education or less. These are the people who just have not benefited from the positive changes that have happened in the economy as a whole…That doesn’t explain everything, because there are people being left behind in Europe, too. The two explanations that have been floated are that Europe has a more elaborate safety net than we have. And most European countries do not allow overprescription of heavy-duty, dangerous painkillers the way we do here.

Check it out.

How the Economy Works: Pepperdine Lecture by Roger Farmer

This is part of the DR Book Collection.

Image result for how the economy works farmer

Anyone familiar with my posts knows that economics is a major interest of mine. Hence, my interest in UCLA economist Roger Farmer’s book How the Economy Works: Confidence, Crashes, and Self-Fulfilling PropheciesFarmer provides a nice, succinct overview of the history of major economic ideas, from Adam Smith to John Maynard Keynes to Robert Lucas. He then provides an interesting merge between the principles of classical and Keynesian economics for economic recovery. Ronald Johnson of the U.S. Bureau of Labor Statistics summarizes Farmer’s position better than I can:

He believes that fiscal policy might help, but it should not involve an increase in government expenditures. However, he also believes that fiscal policy acts more slowly than monetary policy, which he clearly prefers. Since 1951, the Federal Reserve has reacted to recessions by lowering the interest rate it charges to commercial banks. Following the 2008 financial crisis, central banks throughout the world engaged in an unprecedented set of new and unconventional policies known collectively as quantitative easing. This strategy involved the purchase of a kind of asset other than government bonds, namely, mortgage-backed securities. Farmer believes that quantitative easing was the right approach, but that it should have gone further. He proposes qualitative easing, which he defines as a change in the composition of the central bank’s assets. Specifically, he would have the central bank prevent large stock movements, both up and down, from adversely affecting the economy. The bank would assert this control by the use of an index fund, the intent of which would be to manage the value of national stock market wealth by targeting the rate of growth of the fund. The Fed would announce a price path for its index funds, and the central bank would stand by ready to buy and sell the funds each day at the announced price.

Farmer concludes his book with the following:

There is much to be admired in the market system. It is the single most powerful engine of economic growth that human beings have devised. But we have not lived in a free market system for at least a century. The question is not whether to regulate the market—it is how to regulate it. As we learn more about market systems perhaps we will understand better not just why they work well but also how they occasionally fail. It is my hope that we can learn to control the economy that we live in without killing the goose that lays the golden egg (pg. 166-167).

I found Farmer’s ideas interesting, if somewhat unconvincing. The book is useful nonetheless.

You can see a five part lecture by Farmer at Pepperdine University below:

What is the Cost of Corporate Short-Termism?

Some claim that corporate “short-termism“–or what Hillary Clinton called “quarterly capitalism“–has negative effects on the economy. But is there any evidence for the claim? A new McKinsey report answers in the affirmative:

  • From 2001 to 2014, the revenue of long-term firms cumulatively grew on average 47 percent more than the revenue of other firms, and with less volatility. Cumulatively the earnings of long-term firms grew 36 percent more on average over this period than those of other firms, and their economic profit grew 81 percent more on average.
  • Long-term firms invested more than other firms from 2001 to 2014. Although they started this period with slightly lower research-and-development spending, cumulatively by 2014, long-term companies on average spent almost 50 percent more on R&D than other companies. More important, they continued to increase their R&D spending during the financial crisis, while other companies cut R&D expenditure; from 2007 to 2014, R&D spending for long-term companies grew at an annualized rate of 8.5 percent versus 3.7 percent for other companies.
  • Long-term companies exhibit stronger financial performance over time. On average, their market capitalization grew $7 billion more than that of other firms between 2001 and 2014. Their total return to shareholders was also superior, with a 50 percent greater likelihood that they would be in the top decile or top quartile by 2014. Although long-term firms took bigger hits to their market capitalization during the financial crisis than other firms, their share prices recovered more quickly after the crisis.
  • Long-term firms added nearly 12,000 more jobs on average than other firms from 2001 to 2015. Had all firms created as many jobs as the long-term firms, the US economy would have added more than five million additional jobs over this period. On the basis of this potential job creation, this suggests, on a preliminary basis, that the potential value unlocked by companies taking a longer-term approach was worth more than $1 trillion in forgone US GDP over the last decade; if these trends continue, it could be worth nearly $3 trillion through 2025.

2001-2015 performance of long-term and short-term companies on earnings, revenue, and market cap

The report concludes that “the potential value that could have been unlocked had all US publicly listed companies taken a long-term orientation exceeded $1 trillion over the past ten years” (pg. 7).

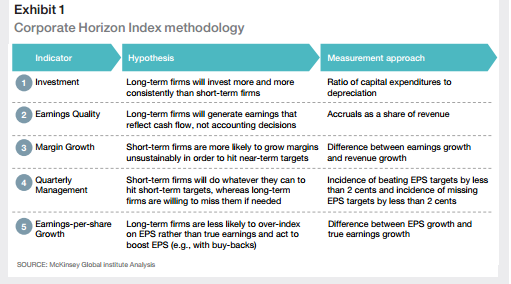
How do the researchers determine that a company is “long-term”? Their Corporate Horizon Index consists of five financial indicators:

In a Harvard Business Review article, the researchers explain,

After running the numbers on these indicators, two broad groups emerged among those 615 large and midcap U.S. publicly listed companies: a “long-term” group of 164 companies (about 27% of the sample), which were either long-term relative to their industry peers over the entire sample or clearly became more long-term between the first half of the sample period and the second half, and a baseline group of the 451 remaining companies (about 73% of the sample). The performance gap that subsequently opened between these two groups of companies offers the most compelling evidence to date of the relative cost of short-termism — and the real payoff that arises from managing for the long term.

…While we can’t directly measure the cost of short-termism, our analysis gives an indication of just how large the value of what’s being left on the table might be. As noted earlier, if all public U.S. companies had created jobs at the scale of the long-term-focused organizations in our sample, the country would have generated at least five million more jobs from 2001 and 2015 — and an additional $1 trillion in GDP growth (equivalent to an average of 0.8 percentage points of GDP growth per year). Projecting forward, if nothing changes to close the gap between the long-term group and the others, then the U.S. economy could be giving up another $3 trillion in foregone GDP and job growth by 2025. Clearly, addressing persistent short-termism should be an urgent issue not just for investors and boards but also for policy makers.

How we manage matters.

Does Kicking Out Immigrants Raise Wages and Employment?

During Kennedy’s presidency, writes The Economist,

the Mexicans were participating in the bracero programme, which allowed almost half a million people a year to take seasonal work on America’s farms. But the parallels with the present are plain. Donald Trump has also complained that immigrants are keeping Americans from good jobs and has promised to do something about it (another parallel: not since Kennedy has America seen such an astonishing presidential coiffure). So it is a good moment for a bracing new assessment of the bracero scheme and its demise.

Did it work? According to a new study, the answer is ‘no’:

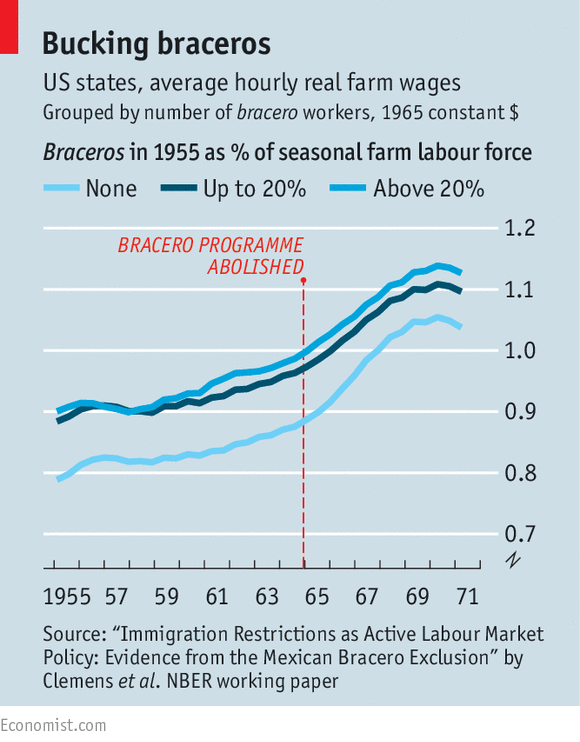
We find that bracero exclusion had little measurable effect on the labor market for domestic farm workers. Pre- and post-exclusion farm wages and farm employment were similar in states highly exposed to exclusion—which lost roughly one third of hired seasonal labor—and in states with no exposure. Bracero workers were not substantially replaced in the years immediately following exclusion with domestic workers, unauthorized Mexican workers, or authorized non-Mexican foreign workers. We find instead that employers adjusted to exclusion, as predicted by the theory of endogenous technical change, with large changes in technology adoption and crop production. We reject the semielasticity of wages to labor scarcity implied by the model in the absence of endogenous technical change, and oer direct evidence of induced technical advance. These findings suggest that new theories of technological change can inform the design and evaluation of active labor market policy (pg. 2).

They conclude,

The exclusion of Mexican bracero workers was one of the largest-ever policy experiments to improve the labor market for domestic workers in a targeted sector by reducing the size of the workforce. Five years after bracero exclusion, leading agricultural economist William E. Martin uncharitably assessed the advocates of exclusion in a little-read book chapter. Those who had believed exclusion would help domestic farm workers “were obviously. . . extremely naïve”, he wrote, and the hoped-for effects in the labor market never arrived because “capital was substituted for labor on the farm and increased effort was exerted by the agricultural engineers in 30 providing the farmers these capital alternatives” (Wildermuth and Martin 1969, 203).

…The theory and evidence we discuss here contradicts a long literature claiming, largely without quantitative evidence, that bracero exclusion succeeded as active labor market policy. We find that bracero exclusion failed to raise wages or substantially raise employment for domestic workers in the sector. The theory of endogenous technical change suggests a mechanism for this null result: employers adjusted to foreign-worker exclusion by changing production techniques where that was possible, and changing production levels where it was not, with little change to the terms on which they demanded domestic labor (pgs. 30-31).

How Do Professors Vote?

They vote Democrat. No one saw that coming…

Image result for you don't say gif imgur

At least those in economics, history, journalism, law, and psychology, according to a 2016 study. The abstract reads,

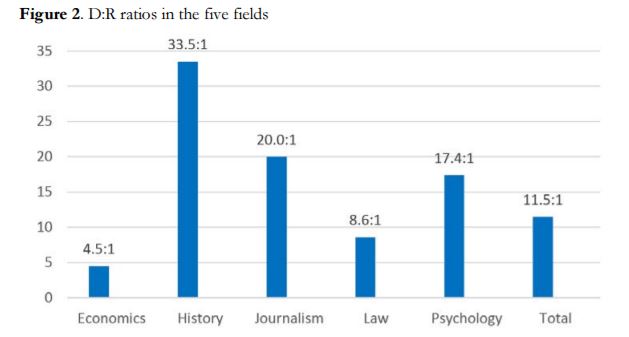
We investigate the voter registration of faculty at 40 leading U.S. universities in the fields of Economics, History, Journalism/Communications, Law, and Psychology. We looked up 7,243 professors and found 3,623 to be registered Democratic and 314 Republican, for an overall D:R ratio of 11.5:1. The D:R ratios for the five fields were: Economics 4.5:1, History 33.5:1, Journalism/Communications 20.0:1, Law 8.6:1, and Psychology 17.4:1. The results indicate that D:R ratios have increased since 2004, and the age profile suggests that in the future they will be even higher. We provide a breakdown by department at each university. The data support the established finding that D:R ratios are highest at the apex of disciplinary pyramids, that is, at the most prestigious departments. We also examine how D:R ratios vary by gender and by region. People interested in ideological diversity or concerned about the errors of leftist outlooks—including students, parents, donors, and taxpayers—might find our results deeply troubling.

Langbert, Quain, Klein, 2016, pg. 425.

Of course, this is nothing new. For example, Jonathan Haidt and colleagues recently highlighted the lack of political diversity in academic psychology. What’s particularly interesting to me, however, is the D:R ratio in economics. I recall a Facebook discussion toward the end of last year in which this bias was downplayed and economic departments were more-or-less given as examples of conservative (read Republican) hubs on campus.[ref]”They have the Hoover Institution at Stanford!” apparently counts as evidence that bias doesn’t exist.[/ref] I already knew this wasn’t true and said as much, but my comment was pretty much ignored. This exchange made me realize that many outsiders likely think mainstream economics is tainted by an American brand of conservatism.[ref]Nevermind that modern Republicans are virtually mercantilists: an economic theory that was refuted in the 18th century.[/ref] But more important, it made me realize that some (many?) on the left reject the findings of mainstream economics because they think it’s politically biased.

So, to those who think economic departments are full of conservatives: yes, these departments are more conservative than others. But the only way they could be labeled “conservative” is due to other departments being so far to the left. Basically, econ departments are more politically diverse. Nonetheless, they are still dominated by Democrats. While this may not instill confidence in my Republican friends, perhaps it will convert some of my Democrat ones.

From Gregory Mankiw’s Principles of Economics, 7th ed. (pg. 32).

Can Marijuana Laws Reduce Prescription Drug Overdoses?

Image result for marijuana laws

According to a 2015 study,

Drug overdoses are the leading cause of death from injuries in the United States today, exceeding deaths from suicide, gunshots and motor vehicle accidents (Murphy et al., 2013). They are also a prime contributor to the recent rise in mortality among middle-aged white Americans (Case and Deaton 2015). In 2010, 16,651 deaths were caused by a prescription opioid overdose, representing nearly 60% of all drug overdose deaths, and exceeding overdose deaths from heroin and cocaine combined (Jones, Mack and Paulozzi, 2013). While a modest decline in opioid overdose deaths has occurred since 2012, more than 16,000 lives are lost annually to prescription opioids (NCHS, 2014).

These numbers are the result of a dramatic rise in morbidity and mortality associated with prescription opioid abuse over the past two decades. The number of fatal poisonings due to prescription pain medications quadrupled between 1999 and 2010. Over the same period, the distribution of opioid pain medications also quadrupled, demonstrating a parallel rise between the distribution of opioid pain medication and its abuse nationally (CDC, 2011). Treatment admissions grew at an even faster rate, increasing nearly six-fold between 1999 and 2009 (CDC, 2011b). Opioid-related emergency department (ED) visits more than doubled from 21.6 per 100,000 in 2004 to 54.9 per 100,000 in 2011, for a total of 1.24 million ED visits involving nonmedical use of pharmaceuticals and pain relievers in 2011 (SAMHSA, 2013a). It is these trends that led the Centers for Disease Control to deem the misuse of prescription opioids in the United States an “epidemic” (pg. 2).

The researchers conclude,

Considerable attention has been paid in the literature to the potential unintended consequences of medical marijuana laws, with people examining impacts of these policies on youth initiation, recreational marijuana use and abuse as well as drunk driving (Wen et al., 2015; Choi, 2014; Lynne-Landsman et al., 2013; Anderson, Hanson and Rees, 2012 & 2013; Pacula et al., 2013). In this paper we consider a potential unintended benefit of these laws: a reduction in the misuse of prescription opiates.

Our results are intriguing in that we find fairly strong and consistent evidence using difference-in-differences, event study, and synthetic control group methods that states providing legal access to marijuana through dispensaries experience lower treatment admissions for addiction to pain medications. We provide complementary evidence that dispensary provisions also reduce deaths due to opioid overdoses. We estimate even larger effects in states that have both legally protected and active dispensaries.

…The fact that opioid harms decline in response to medical marijuana dispensaries raises some interesting questions as to whether marijuana liberalization may be beneficial for public health. Marijuana is a far less addictive substance than opioids and the potential for overdosing is nearly zero (Hall and Pacula, 2003). However, it remains unclear from our current analysis whether the findings we observe are short term or persist. In addition, we ultimately need to weigh any potential indirect benefits from medical marijuana dispensary provisions in terms of its implied reductions in opiate misuse (or other positive outcomes) against any potential negative impacts of these provisions on other factors, such as tobacco use and drugged driving. At a minimum, however, our results suggest a potential overlooked positive effect of dispensary enabling medical marijuana laws (pgs. 21-22).

The Effects of Climate Change on the U.S. Economy

Climate change could have massive negative effects on the U.S. economy according to a new study:

We exploited random fluctuations in seasonal temperatures across years and states, using the richness of historical data available in the US. We employed a panel regression framework with the growth rate of gross state product (GSP) and average seasonal temperatures for each US state, and found that summer and autumn temperatures have opposite effects on economic growth. An increase in the average summer temperature negatively affects the growth rate of GSP. An increase in the autumn temperature positively affects this growth rate, although to a lesser extent. This suggests that previous studies’ aggregation of temperature data into annual temperature averages may mask the heterogeneous effects of different seasons.

The summer effect is particularly pronounced in data since 1990. This leads to a negative net economic effect of rising temperatures. This implies that the US economy is still sensitive to temperature increases, despite the adoption of adaptive technologies such as air conditioning (Barreca et al. 2015). Temperature also has a stronger effect in states with relatively high summer temperatures, most of which are located in the south.

Our analysis quantified the effect of rising temperatures across sectors of the US economy. We find that an increase in average summer temperature has a pervasive effect on all industries, not just the sectors that are traditionally assumed to be vulnerable to climate change…In our empirical analysis, an increase in the average summer temperature decreased the annual growth rate of labour productivity. An increase in the average autumn temperature had the opposite effect. Our analysis used data at the macroeconomic level, but it is consistent with existing studies of this relationship at the microeconomic level (Zivin and Neidell 2014, Cachon et al. 2012, Zivin et al. 2015).

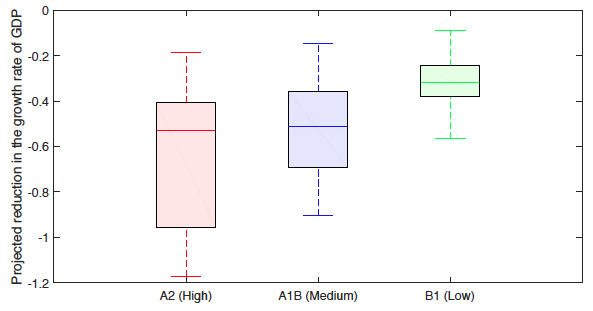
The authors find that the long-term effect of climate change would be a reduction in “the growth rate of US output by 0.2 to 0.4 percentage points by the end of the century. At the historical growth rate of US GDP of 4% per year, this would correspond to a reduction of up to 10%. The results are even more dramatic in the high emissions scenario (A2). Here, the reduction of economic growth could reach 1.2 percentage points, corresponding to roughly one-third of the historical annual growth rate of the US economy.”

You can see economist Bridget Hoffman explain the findings below:

These results echo Joseph Heath’s analysis of climate change’s effects on the global economy. But perhaps more important, it helps drive home his main point: climate change will drastically reduce economic growth over the next 100 years without intervention. But people will still be be significantly better off compared to us today even if we fail to act (check the GDP graph at about 0:46). They just won’t be as well off as they could have been.

Policy makers should consider both of these facts when discussing how to combat climate change.

Immigration and Prosperity

According to The New York Times,

President Trump on Wednesday began a sweeping crackdown on illegal immigration, ordering the immediate construction of a border wall with Mexico and aggressive efforts to find and deport unauthorized immigrants. He planned additional actions to cut back on legal immigration, including barring Syrian refugees from entering the United States.

Vox reports,

The four remaining draft orders obtained by Vox focus on immigration, terrorism, and refugee policy. They wouldn’t ban all Muslim immigration to the US, breaking a Trump promise from early in his campaign, but they would temporarily ban entries from seven majority-Muslim countries and bar all refugees from coming to the US for several months. They would make it harder for immigrants to come to the US to work, make it easier to deport them if they use public services, and put an end to the Obama administration program that protected young “DREAMer” immigrants from deportation.

In all, the combined documents would represent one of the harshest crackdowns on immigrants — both those here and those who want to come here — in memory.

Much like trade, I’ve spent the last year writing about the economics of immigration. Some of my findings are:

Sure enough, more evidence comes rolling in. A new IMF study finds

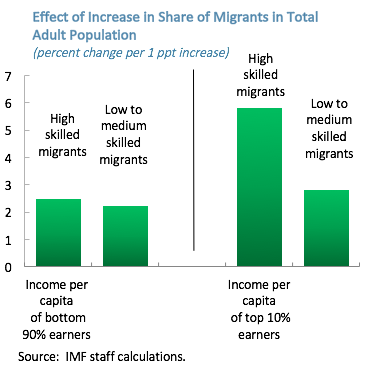
that migrants help increase per capita income levels in host advanced economies, and this effect is both statistically and economically significant. Our estimates suggest that a one percentage point increase in the share of migrants in the adult population (the average annual increase is 0.2 percentage point) can raise GDP per capita by up to 2% in the long run. Moreover, this effect comes mainly through an increase in labour productivity and, to a lesser extent, through the more standard channel of an increase in the ratio of working-age to total population.

The result survives a number of robustness checks, which include controlling for other determinants of income per capita (trade openness, the level of technology, the education level, and age structure of the host population, and policy variables); excluding from the sample countries that were created through migration and have high income levels (USA, Canada, Australia, and New Zealand); and using alternative gravity model-based instruments.

We find that both high- and low-skill migrants raise labour productivity. There is no evidence of major physical or human capital dilution, as investment adjusts over time to the larger pool of workers, and migrants are increasingly high-skilled. Instead, our results suggest that the complementarities that earlier analyses uncovered mostly at the micro level are also relevant at the macro level. The evidence from the microeconomic literature suggests that the positive productivity effects come from increased TFP and human capital. High-skilled migrants contribute to productivity directly, including through innovation, and indirectly through their positive spillovers on native workers. Low- and medium-skilled migrants can also contribute to aggregate productivity, to the extent that their skills are complementary to those of natives, promoting occupational reallocation and task specialisation.

…Our analysis finds…that the gains from immigration are broadly shared across the population. Migration increases the average income per capita of both the bottom 90% and the top 10% of earners, even though high-skilled migration benefits more top earners — possibly because of a stronger synergy between migrants and natives with high skills. Moreover, the Gini coefficient — a broad measure of income inequality within the bottom 90% of earners — is not affected by the migrant share.

Let them come.