With populist and nationalist forces making significant gains in democratic states, 2016 marked the 11th consecutive year of decline in global freedom.
There were setbacks in political rights, civil liberties, or both, in a number of countries rated “Free” by the report, including Brazil, the Czech Republic, Denmark, France, Hungary, Poland, Serbia, South Africa, South Korea, Spain, Tunisia, and the United States.
Of the 195 countries assessed, 87 (45 percent) were rated Free, 59 (30 percent) Partly Free, and 49 (25 percent) Not Free.
The Middle East and North Africa region had the worst ratings in the world in 2016, followed closely by Eurasia.
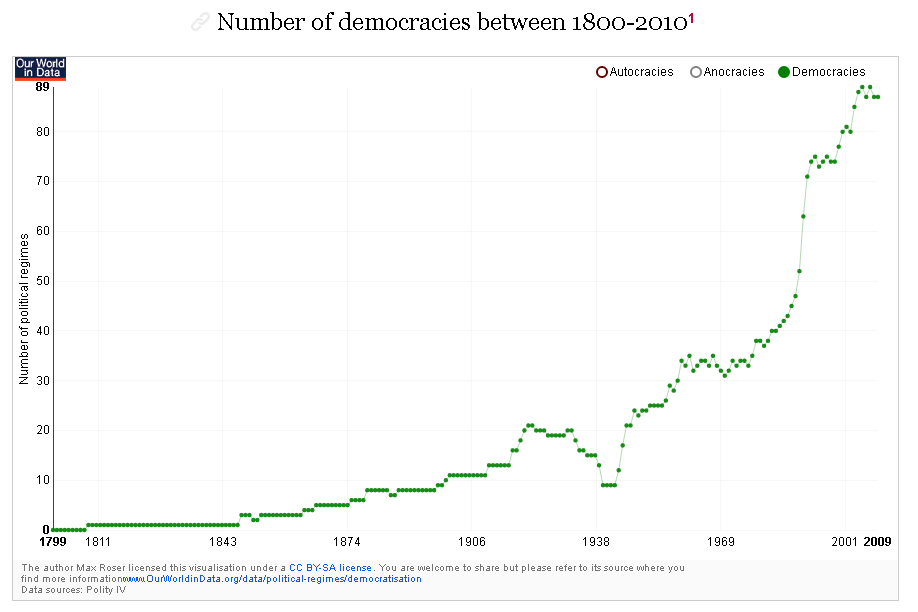
The report is appropriately titled “Populists and Autocrats: The Dual Threat to Global Democracy.” We’ve written about the dangers of populism here at Difficult Runbefore and how closed societies are detrimental to flourishing. Despite it being “the 11th consecutive year of decline in global freedom,” it’s worth noting the long-term trend:
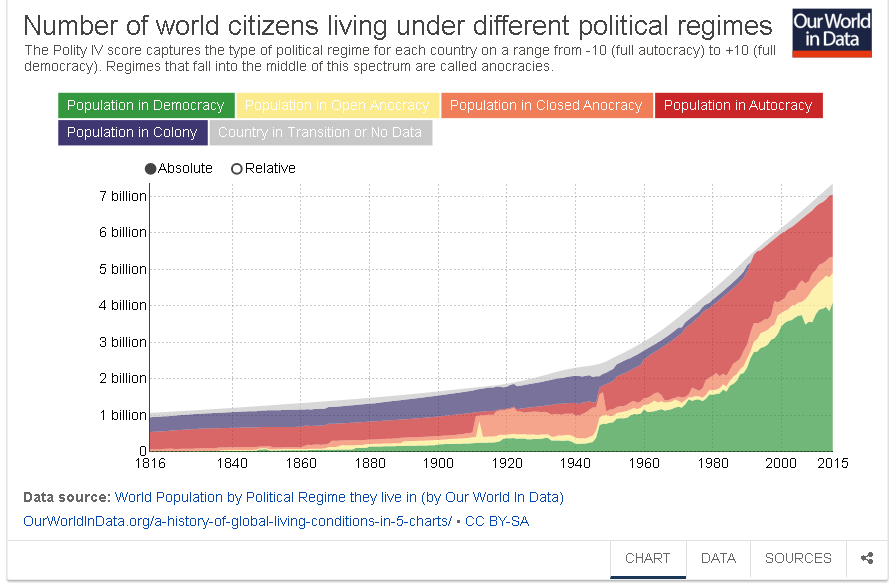
More people live in democracies than ever before:
Let’s hope this recent downturn in global freedom is just a blip in an overall positive trajectory.
Last year, Ro had a brief piece about how Germany offers free college, not the “college experience”. The results of free college are arguably underwhelming. But the debate over college isn’t new, but can be found in the writings of Adam Smith. As The Atlantic explains,
While extravagances such as hot tubs, movie theaters, and climbing walls may seem to make this discussion distinctively modern, parts of today’s college-cost dilemma are recognizable, in fact, in an 18th-century debate about how best to finance a university’s operations. It was so important that Adam Smith took time out of analyzing more traditional economic subjects like the corn laws to devote a long section of The Wealth of Nations to it. And with cause: The Scottish universities of the 18th century, much like America’s today, had been quickly becoming the universally acknowledged ticket to social advancement.
Smith, despite accusations of Connery-esque misplaced nationalism, was justly proud of the Scottish system of universities, which ran on a radical (by today’s standards, at least) system in which students paid their professors directly…But by the end of the century, it had five of the most cutting-edge universities in Europe, one of the world’s best medical schools, and a booming professional class from which its southerly neighbor and occupier frequently drew its doctors, lawyers, and professors. It had pioneered the study of English literature as a subject, having perceived that for many of its students, raised speaking Scots or Gaelic, English actually was a foreign language. It offered up world-class Enlightenment philosophes such as David Hume, Adam Ferguson, and Adam Smith, all of whom were at least partially educated in its universities.
Smith noted the differences between the universities of Scotland and Oxford where later attended:
In Scotland, students exercised complete consumer control over with whom they studied and which subjects they deemed relevant. Oxford—and in fact most other European universities—employed a system similar to the way that American universities handle tuition payments today: One tuition payment was made directly to the university, and the university decided how to distribute what came in…Smith points out how [Oxford] often fell short of the Scottish system, where direct payment of fees served as motivation for faculty responsibility. “The endowments of [British] schools and colleges have necessarily diminished more or less the necessity of application in the teachers,” Smith writes in his opening sally against bundling the costs of education. “In the university of Oxford, the greater part of the publick professors have, for these many years, given up altogether even the pretence of teaching.” In the the Scottish system, “the salary makes but a part, and frequently but a small part of the emoluments of the teacher, of which the greater part arises from the honoraries or fees of his pupils,” he explains.
What’s wrong with the Oxford (and contemporary universities generally) approach?
Prices are information about what people need and want, so the trouble with bundling together a large number of services on a single bill is that it becomes difficult to tell exactly what one is paying for, or for the people sending out that bill to determine what students in fact want to pay for. In the current American system, such decisions are based on fluctuation in enrollment—a very high-level piece of data that can encompass any number of students’ preferences—but not on the micro-level of whether the students of Texas Tech University, for instance, really wanted a water park instead of more or better Spanish-language instructors.
There are potential problems to the Scottish approach. For example,
evidence has recently pointed to the patent unfairness and sexism of student evaluations of their professors. Many an academic has bemoaned the growing “customer” mentality of their students, and with good reason: It can lead to grade inflation and a subsequent lowering of standards. But as Smith would surely have appreciated, the right incentives could bring 18-year-olds to seek out the highest-quality teachers rather than the most forgiving graders. That’s how it worked in Scotland in the 18th century, where there was a simple way of dealing with the problem that the best professors were not always the easiest fellows: rigorous, frequent, and comprehensive oral and essay examinations, which were administered in lieu of evaluations in individual courses. Students were allowed to select which university services and which university teachers they would pay for, but in the end if they could not pass a university-wide exam, their choice to take the 18th-century equivalent of Rocks for Jocks would have been swiftly punished.
Retirement may not be all it’s cracked up to be. A MarketWatch article reports,
More retirees than ever say they are “not at all satisfied” with retirement, according to a study published this year from the Employee Benefit Research Institute. The institute used data from the University of Michigan’s Health and Retirement Study, collected from 1998 to 2012, in which more than 20,000 people are interviewed every two years.
The number of retirees reporting just moderate satisfaction with retirement increased from 31.7% to 40.9% and those who are completely unsatisfied with retirement climbed above 10%, up from fewer than 8% in 1998. Meanwhile, the number of retirees who say their retirement is “very satisfying” has dropped from 60.5% in 1998 to 48.6% in 2012 — the first time it’s ever dipped below half.
The study authors did not investigate the reasons behind these satisfaction dips, but other studies suggest that some of the reasons may be financial. Research published in 2004 by Constantijn Panis, who has a Ph.D. in economics and is also an expert in demographic issues, found that getting payouts from a pension was positively related to retirement satisfaction. But as the number of retirees drawing on traditional pensions declined — from 1980 to 2008, the proportion of non-government, salaried workers who got a traditional pension fell from 38% to 20% — retirement satisfaction may be dipping accordingly.
…Studies show that today’s retirees want more and varied activities in retirement, including flexible jobs, than did previous generations of retirees. Plus, surveys show that boomers — who are retiring in droves in recent years — are in general less happy than members of the so-called silent generation, and that may be reflected in these numbers.
Of course, it’s worth noting that the overwhelming majority report being satisfied with retirement. We shouldn’t create a crisis where there is none. Nonetheless, the uptick may be something we want to keep an eye on. In the Gallup-published Wellbeing: The Five Essential Elements, the authors Tom Rath and Jim Harter explore five elements to overall well-being:
Career Wellbeing – how one’s time is occupied.
Social Wellbeing – the strength of one’s relationships.
Financial Wellbeing – effectively managing one’s economic life.
Physical Wellbeing – having good health and enough energy on a daily basis.
Community Wellbeing – engagement with the area in which one lives.
One of the more encouraging findings [of one study] was that, even in the face of some of life’s most tragic events like the death of a spouse, after a few years, people do recover to the same level of wellbeing they had before their spouse passed away. But this was not the case for those who were unemployed for a prolonged period of time — particularly not for men. Our wellbeing actually recovers more rapidly from the death of a spouse than it does from a sustained period of unemployment. This doesn’t mean that getting fired will harm your wellbeing forever. The same study also found that being laid off from a job in the last year did not result in any significant long-term changes. The key is to avoid sustained periods of unemployment (more than a year) when you are actively looking for a job but unable to find one. In addition to the obvious loss of income from prolonged unemployment, the lack of regular social contact and the daily boredom might be even more detrimental to your wellbeing.
This is likely why the MarketWatch article encourages retirees to “find things you love to do” and “plan how to use your time.” Wise advice.
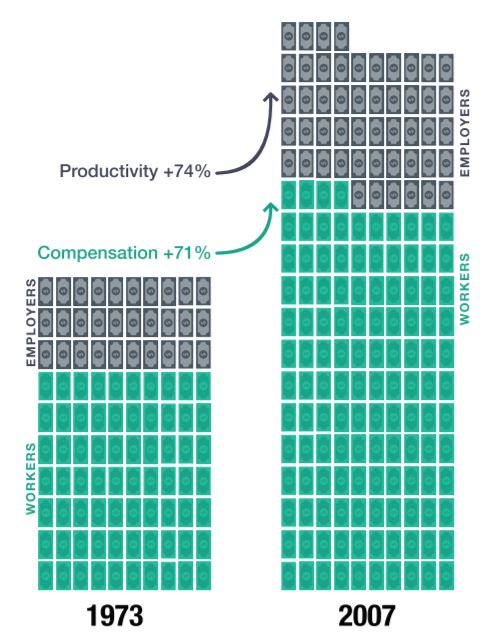
The above chart from the Economic Policy Institute has become a staple in the “wage stagnation” debate. I talked about it before a couple years ago, but I thought I’d revisit it since there have been a couple responses to the EPI since then. Scott Winship, formerly of Brookings and now at the Manhattan Institute, writes,
The Economic Policy Institute (EPI)…has created a widely cited chart indicating that productivity rose 72 percent during 1973–2014 while median hourly compensation rose by a measly 9 percent. The implication is that rising inequality and declining employer generosity mean that policies that promote economic growth will fail to lift middle-class living standards and that more redistribution is necessary to assist working families.
In arriving at this conclusion, EPI makes numerous faulty methodological decisions. It understates growth in median hourly compensation by using a deficient inflation adjustment and by undervaluing benefits other than health insurance. It overstates the divergence between productivity and median hourly compensation trends by using different inflation adjustments for each. It includes imputed rents in national income, which exerts a downward pull on labor’s share of income. It includes the self-employed in its analyses, for whom it makes little sense to distinguish between labor income and capital income. And it includes government and nonprofit workers, whose productivity is not well measured (pg. 4).
Winship instead finds the following:
During 1973–2007, U.S. hourly compensation rose 71 percent, while productivity rose 74 percent.
In 1973, U.S. workers received 70 percent of the income produced by businesses; in 2007, they received 69 percent.
For the past 70 years, labor’s share of income has fluctuated—almost without exception—between 67 percent and 71 percent.
Since 1929, the U.S. business cycles with the highest productivity growth have also featured the highest growth in hourly compensation.
Male and female middle-class workers saw faster growth in pay during 1989–2000 and 2000–07 than during 1973–79, when productivity growth was slower.
Middle-class pay has not stagnated: during 1997–2011, productivity rose by 35 percent, aggregate compensation rose by 32 percent, median hourly compensation increased by 20 percent, median female pay climbed by 25 percent, and median male pay grew by 18 percent.
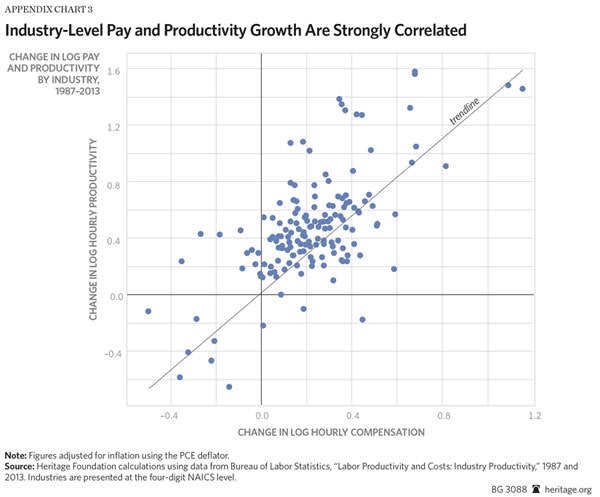
Academic economists largely reject this analysis and the conclusion that salary no longer grows with productivity. Harvard professor Martin Feldstein, the former president of the National Bureau of Economic Research, concluded that the apparent divergence results from comparing the wrong data. Using the correct data, he finds that pay and productivity have both grown together. Staff at the Federal Reserve Bank of St. Louis found the same result.
Even prominent liberal economists who have examined this question agree. Dean Baker, director of the Center for Economic and Policy Research, finds that pay growth tracks productivity growth when comparing the same groups of workers and using the same measure of inflation. Harvard professor Robert Lawrence served on President Bill Clinton’s Council of Economic Advisers; he comes to the same conclusion. George Washington University professor Stephen Rose—a former Clinton Administration Labor Department official currently affiliated with the Urban Institute—likewise finds that the apparent gap between pay and productivity collapses under scrutiny. He concludes that productivity growth continues to benefit working Americans.
Most economists who examine the issue conclude that firms pay workers according to the value they produce.
In my view, one of the most glaring errors of the EPI’s methodology is the following:
EPI compares compensation for production and non-supervisory employees—which covers about five-eighths of the total economy—to the productivity of all workers in the economy. Economic theory does not predict that the pay and productivity of different groups of employees will necessarily track each other, especially in the presence of barriers to mobility.
Even abstracting from analytical errors, EPI can claim no more than that pay and productivity have grown differently among different groups of workers. EPI’s data say nothing about whether workers’ pay has grown in step with their own productivity.
Check out the full analyses by both Winship and (especially) Sherk.
By now you’ve all heard about United Airlines forcibly removing David Dao from a flight. That happened on Sunday, April 9th, and so over the past few days we’ve had time for the first-round “analysis” (United is the devil incarnate) along with the second-round “analysis” (United is angelic) and even quite a lot of third-round “analysis” (capitalism is the devil). But we’re only just now starting to get the kinds of analysis that don’t deserve the Bunny Quotes of Shame.[ref]Apparently this not a real thing. But, like the CAPS LOCK OF ANGRY, ANGRY DOOM, it should be.[/ref]
Or you could call them the Air Quotes of Shame, I guess.
Newsweek is running one of the first of these analyses, and it concludes that United may actually have violated their own contract when they forcibly removed Dao from his seat. The contract allows them to prevent passengers from boarding in the event of an oversold flight, but the problem is that the flight wasn’t oversold (for one) and that Dao was kicked off after boarding rather than being denied boarding (for another).[ref]Overselling is a common practice in the airline industry. Since out of a few hundred people who are buy tickets at least a couple won’t show up, the airlines sell a couple more seats than they have tickets to ensure their planes are as full as possible. However in this case, it wasn’t a matter of overselling, but rather of four United employees who needed to hitch a ride.[/ref] There are also provisions for kicking someone off a plan after they’ve boarded, but none of those provisions appear to apply in this case, either.
This is far from the last word. Jens David Ohlin, who wrote the piece, is a lawyer who’s read the contract, but he’s relying for his facts on news reports of what happened. He doesn’t have any more access to the facts than the rest of us. The “last word” is probably months or even years away, at the end of one or more lawsuits.
I wrote this post because I thought Ohlin’s analysis was interesting. But also because the whole “first post” syndrome is interesting in its own right. Over a decade ago, I spent way too much time on Slashdot.[ref]I just had to check to see if it still exists. It does.[/ref] It’s a social news site–kind of like a pre-Reddit with only one forum and centered on tech–and one of the little oddities is that whenever a new topic was posted there was an immediate rush of utterly useless replies that said only “first post” (or intentional misspellings thereof, sometimes with vulgar and offensive commentary added in for trollish fun.) The replies were utterly useless, the Slashdot filtering algorithms almost always rendered them invisible for most users, but still there were actual human beings out there who either frantically typed and clicked to try and earn that first post privilege or, perhaps more depressingly, spent their time writing macros or scripts to win the prize for them.
Well, the initial reactions to the United debacle–as with all such controversies–are basically wordier versions of the same thing, just content-free “first post” declarations. Don’t get me wrong, some of them were hilarious. The memes were great. (And some of the Slashdot first posts, every now and then, were funny too.) But nobody knew what they were talking about. Seriously, nobody. As far as I can tell, 5 days later, we’re just starting to get analysis that isn’t a total waste of time to read. So, referring to all the blog posts over the past few days, why do people write this stuff? Why does anyone read it?
Those are kind of dumb questions. People read this nonsense because they’re curious and impatient. And people write it because they want attention. I’m not immune. In 2015 I wrote two hot-take pieces[ref]Here’s one. Here’s another.[/ref] because I wanted to catch that viral wave. They were both shared widely on Facebook, but I noticed from the stats that only the headline of the first was shared. Practically nobody clicked the link to read my post. And on the second, as more facts came to light I realized my “analysis” had been exactly the kind of facile, self-righteous rush to judgment I usually deplored.
I had another encounter with hot-take fame earlier this year when I wrote a fairly negative review of the newest book in The Expanse series. I listened to the book right after it came out, wrote a review like I always do, posted it, and then was perplexed to see comments and likes start pouring in. It turns out that–just like with news stories–whoever gets the first reviews out for a new book gets the most attention. This is why there are so many people who cheat and write “reviews” weeks or months before the book actually comes out.[ref]Some of them have ARCs–advanced reader copies–but it’s obvious that most do not.[/ref] And–also just like with news stories–the hot takes break down into simplistic takes: 4- or 5- star raves and 2- or 1- star slams. As of right now, my review appears to still be at the top of the list of over 800 reviews. I doubt it would have done so well if I’d published the review later or published it with 3-stars.
So I get it, the temptation to write and to read rapid reactions is strong. But it’s also–usually–a waste of time. We can get more accurate info and more reliable, interesting analysis if we can just wait a few days. And if enough people do that, maybe we can find a way to curb first post syndrome.
The Economist reported on a new project titled “Why We Post” that “refute[s] much received wisdom” regarding the use of social media:
Selfies: Are selfies guilty of “fostering self-regard and an undue focus on attractiveness”? “In Italy girls were indeed seen to take dozens of pictures of themselves before settling on one to post. In Brazil many selfies posted by men were taken at the gym. But at the British site, Dr Miller found, schoolchildren posted five times as many “groupies” (images of the picture-taker with friends) as they did selfies. Britons have also created a category called “uglies”, wherein the purpose is to take as unflattering a self-portrait as possible. And in Chile another unique genre has developed: the “footie”. This is a shot taken of the user’s propped-up feet, a sign of relaxation.”
Memes: Do memes “debase traditional forms of public debate…spreading far and wide with little context”? “In India they tend to focus on serious and religious issues; Trinidadian memes are more often send-ups of politicians. Yet in all cases Dr Miller sees meme-passing not as limiting what social-media users think and say, but as enabling discourse. Many users happily forward memes laced with strong ideological messages about which they would not dare to comment individually.”
Image: Are profiles “false fronts designed for the medium at hand”? Trinidadians “see online profiles as more representative of a person’s true self even than what is seen in real life. And, though the perceived loss through social media of the anonymity that once characterised online life causes much hand-wringing in the West, young boys and girls in Turkey see things differently. Social media permit them to be in constant contact with one another, in full view of their parents, but to keep their conversations and photos to themselves.”
Distraction vs. Education: “In rural China and Turkey social media were viewed as a distraction from education. But in industrial China and Brazil they were seen to be an educational resource. Such a divide was evident in India, too. There, high-income families regarded them with suspicion but low-income families advocated them as a supplementary source of schooling. In Britain, meanwhile, they were valued not directly as a means of education, but as a way for pupils, parents and teachers to communicate.”
The project “refutes the idea that social media are making humans any less human…The sceptics’ reaction to new technology seems equally deep-rooted. New means of communication from railways and the telegraph onwards have always attracted critics. Sooner or later, the doubters either convert, or die.”
Is the TSA worth the cost? According to Vox, the answer is likely ‘no’. “The TSA’s inefficiency isn’t just aggravating and unnecessary;” writes Dylan Matthews, “by pushing people to drive instead of fly, it’s actively dangerous and costing lives. Less invasive private scanning would be considerably better. The TSA is hard to evaluate largely because it’s attempting to solve a non-problem. Despite some very notable cases, airplane hijackings and bombings are quite rare. There aren’t that many attempts, and there are even fewer successes. That makes it hard to judge if the TSA is working properly — if no one tries to do a liquid-based attack, then we don’t know if the 3-ounce liquid rule prevents such attacks.”
In order to test the TSA’s effectiveness, Homeland Security officials “pretended to be terrorists, and tried to smuggle guns and bombs onto planes 70 different times. And 67 of those times, the Red Team succeeded. Their weapons and bombs were not confiscated, despite the TSA’s lengthy screening process. That’s a success rate of more than 95 percent.” Granted, the point of the security measures is “to make terrorists change their plans” rather than catch them at the airport. In short, “there’s basically zero evidence the agency has prevented any attacks”:
The TSA claims it won’t provide examples of such cases due to national security, but given its history of bragging about lesser successes, that’s a little tough to believe. For instance, the agency bragged plenty about catching Kevin Brown, an Army vet who tried to check pipe bomb-making materials. Brown wasn’t going to blow up the plane — the unfinished materials were in his checked luggage — but if the TSA publicized that, why wouldn’t it publicize catching someone who was trying to blow up the plane?
The Government Accountability Office is also skeptical that the TSA is stopping terrorists. It concluded in 2013 that there’s no evidence the agency’s SPOT program, which employed 2,800 as of the study and attempts to scan passengers for suspicious behavior, is at all effective. Only 14 percent of passenger flaggings by TSA officers led to a referral to law enforcement. Only 0.6 percent of TSA flaggings led to an arrest. None of those arrests were designated as terrorism-related.
What about the most loathed TSA rules: the shoe removal requirement, and the ban on all but the tiniest containers of liquids? There’s never been any evidence that these are effective. Remember: We caught the people who tried to attack with their shoes and with liquid explosives, without these rules in place. Europe is gradually phasing out the liquid ban.
Beyond the lack of evidence in favor of the TSA, the agency may actually be leading to more deaths:
One paper by economists Garrick Blalock, Vrinda Kadiyali, and Daniel Simon found that, controlling for other factors like weather and traffic, 9/11 provoked such a large decrease in air traffic and increase in driving that 327 more people died every month from road accidents. The effect dissipated over time, but the total death toll (up to 2,300) rivals that of the attacks themselves.
Another paper by the same authors found that one post-9/11 security measure — increased checked baggage screening — reduced passenger volume by about 6 percent. Combine the two papers, and you get a disturbing conclusion: In their words, over the course of three months, “approximately 129 individuals died in automobile accidents which resulted from travelers substituting driving for flying in response to inconvenience associated with baggage screening.”
This isn’t just one set of studies; there’s other evidence that 9/11 led to an increase in driving, which cost at least a thousand lives. The 129 deaths per quarter-year figure is, as Nate Silver notes, “the equivalent of four fully-loaded Boeing 737s crashing each year.”
You can dispute the precise figures here; these are regression analyses, which are hardly perfect. But it stands to reason that having to get to the airport two or three hours before a flight reduces demand for flights relative to a world where you only have to arrive 30 minutes beforehand — particularly for flights on routes where a two- to three-hour wait dramatically increases travel time relative to driving, like New York to Washington, DC, or Boston to New York. That means more driving. That means more death.
That might be worth it for a system that we know for a fact prevents attacks. But there’s no evidence the TSA does…The solution is clear: Airports should kick out the TSA, hire (well-paid and unionized) private screeners, and simply ask people to go through normal metal detectors with their shoes on, their laptops in their bags, and all the liquids they desire. The increased risk would be negligible — and if it gets people to stop driving and start flying, it could save lives.
This is a common rallying cry among Americans (e.g., Bernie Sanders) who are disturbed by income inequality in the U.S. and the supposed excesses of capitalism. So what can the United States learn from Sweden? Swedish author Johan Norberg writes,
As a native of Sweden, I must admit this makes me Feel the Bern a bit. Sanders is right: America would benefit hugely from modeling her economic and social policies after her Scandinavian sisters. But Sanders should be careful what he wishes for. When he asks for “trade policies that work for the working families of our nation and not just the CEOs of large, multi-national corporations,” Social Democrats in Sweden would take this to mean trade liberalization—which would have the benefit of exposing monopolist fat cats to competition—not the protectionism that Sanders favors.
In fact, when President Barack Obama visited Sweden in 2013, the three big Swedish trade unions sent him a letter requesting a meeting. Their agenda: a discussion of “how to promote free trade.” The chairman of the largest Social Democratic trade union scolded the American president for his insufficient commitment to the free flow of goods.
Norberg acknowledges that Sweden is “still-high public spending and high taxes, at least compared to the U.S….The governments provide the citizens with health care, child care, free colleges, and subsidized parental and medical leave. We Scandinavians have our quarrels with these systems and how they function, but at least they have not ruined our societies; indicators of living standards and health are impressive.” So how come this amount of government services doesn’t cripple the economy? Norberg explains,
One reason is that we compensate for them with a more open economy than others. In the summary Fraser Institute rankings, Sweden and Denmark are more economically free than the United States when it comes to legal structure and property rights, sound money, free trade, business regulation, and credit market regulations. We don’t have the multitude of occupational licensing laws that block competition in the United States.
We also pay for the welfare state in a fairly brutal way, but one that doesn’t hurt production as much: by squeezing the poor and the middle class. Unlike the rich, poor and middle-class people don’t flee or dodge when they’re taxed aggressively.
The Social Democrats knew all along that they couldn’t fund such a generous government by taking from the rich and the businesses—there are too few of them, and the economy depends on them too much. So Sweden and Denmark take in lots of revenue via highly regressive value-added taxes at a normal rate of 25 percent of sales—the only tax where the rich and poor pay exactly the same amount in kronor. On the other hand, the corporate tax is just 22 and 23.5 percent respectively, compared to the U.S. rate of 35 percent.[ref]Check out this analysis of the Scandinavian tax systems at the Tax Foundation.[/ref]
In fact, rich people in Sweden enjoy several economic advantages not offered to their lower-class counterparts. Sweden always admitted very generous tax deductions for capital costs. Labor regulations are tailored to benefit big companies. To attract highly educated specialists from abroad, Sweden now has a beneficial “expert tax” for them, which shields 25 percent of their wages from taxation for a three-year period. “Sure, it is unfair, but we have no better solution,” the Social Democratic minister of finance said in 2000, when he implemented special tax exemptions for individuals and families who owned a large share of a listed company.
Unlike Sanders, Scandinavian socialists have concluded that you can have a big government or you can make the rich pay for it all, but you can’t do both.
The shape of welfare state also has roots in Swedish culture:
Two Scandinavian economists, Andreas Bergh and Christian Bjørnskov, have documented that a high degree of trust is an old legacy, and that descendants of those who emigrated from Scandinavia 100 years before the welfare state are also more trusting. Their conclusion is that trust in others and social cohesion creates the welfare state rather than the other way around, since it is more tempting to give power to politicians and money to strangers if you believe that they are decent people who would never cheat the system.
Scandinavians have always frowned on those who take money they are not entitled to. Sweden is, after all, the country where the leading candidate for prime minister in 1995 had to resign because it was revealed that she had used her official credit card to pay for some small private expenses, even though she always, every month, paid the credit card debt herself.
When asked, “Under what circumstances is one justified in accepting government benefits to which one is not entitled?” in 1991 and 1998, the Nordics led the world in saying “never.” (Only Malta says it is more upstanding, and a brief canvass of Maltese of my acquaintance suggests that they are rather likely to have lied on the survey.) Oh, and the United States is 16th, lower on the list than even the Italians.
Unfortunately, Sweden has recently seen “increased unemployment among immigrants. Now the employment gap between natives and foreign-born in Sweden is twice the European Union average, even though we express less racist and discriminatory attitudes than others. In response, Swedish politicians have recently decided to abandon liberal immigration policies and do whatever they can to scare people away. It was easier to have a one-size-fits-all approach when we were all alike, from the same background, with the same faith and attitude and a similar education. We need a more flexible model now that we are becoming a little bit more like…well, the United States.”
What explains Sweden’s high level of income equality?
What were the causes of Sweden’s problems from 1970 to 1995?
How is it possible that Sweden, since the crisis of the early 1990s, is growing faster than most EU countries despite its high taxes and generous welfare state?
His conclusions?
In many aspects, Sweden is not very different from other countries. The accelerating economic growth in Sweden around 1870 was most likely largely a result of liberalizations and well-functioning capitalist institutions. In this respect, there is no Swedish exceptionalism.
When it comes to equality, the most important conclusion is that most of the decrease in income inequality in Sweden occurred before the expansion of the welfare state. A number of seemingly unrelated reforms, such as land reforms, school reforms and the occurrence of unions and centralized wage bargaining, are likely explanations. Interestingly, at least parts of gender equality in Sweden seem to be an unintended consequence of the need to increase labor supply by using women in the workforce.
Thus, when it comes to the roots of prosperity and equality, the lessons from Sweden are not very different compared to the lessons from mainstream institutional economics: Well-functioning capitalist institutions, especially property rights and a non-corrupt state sector, promotes prosperity. Primary schooling, risk sharing social insurance schemes and labor unions contribute to a more equal distribution of income (pg. 21).
He notes that Sweden’s lagging economy between 1970 and 1995 was due to a
combination of unsuccessful macro-economic policies and a very generous welfare state…During the period of lagging behind, excessive state interventionism hampered structural adjustment and economic development in general. The economy was much less capitalist, rules were unstable, policy unpredictable, and work incentives were weakened by the design of taxes and benefits. This leads to the conclusion that to successfully combine a large welfare state with economic growth, macroeconomic factors are crucial and a high degree of economic openness may actually foster policies that promote competitiveness. Analyzing the fact that Sweden was ranked the second most competitive country in the world according to the Global Competitiveness Index 2010–2011 (just slightly behind Switzerland). Eklund et al. (2011) emphasize the role of market deregulations, inflation control and stricter budget rules – but also some lowering of taxes and benefit levels. The upshot is that the policy implications from the case of Sweden are hard to classify along a simple right-left scale: the welfare state seems to survive because it coexists with high levels of economic freedom and well-functioning capitalist institutions (pg. 22).[ref]You can read about the Swedish reforms since the 1990s here.[/ref]
So, be like Sweden. But be like it in the right ways.
It depends on how you measure it. According to a recent NBER paper by Dartmouth economist Bruce Sacerdote, most estimates use the CPI-U as a price deflator. Sacerdote instead
calculate[s] real wages using either the Fed’s preferred inflation measure of PCE (Personal Consumption Expenditures) or using simple adjustments to CPI using magnitudes suggested by the Boskin commission (Boskin et al 1996) and Costa (2001). This adjustment reverses the finding of wage stagnation. Using the PCE to deflate nominal wages suggests real wage growth of 24 percent from 1975-2015 or about .54% growth in real wages per year. Importantly that growth is significantly less than the 1.18% annual growth in real wages (using PCE inflation) seen in the earlier decade 1964-1975 and is significantly less than GDP per capita growth of 1.8 percent over the 1975-2015 period. But 24 percent growth over the 1975-2015 is substantially better than zero growth and the PCE inflation could itself still contain upward bias. Adjusting for the Hamilton (1998) and Costa (2001) estimates of CPI bias implies real wage growth of 1 percent per year during 1975-2015 and GDP per capita growth of 2.7 percent per year.
In short, “PCE adjusted wages appear to have grown at .5% per year during 1975-2015 while the de-biased CPI adjusted wages grew at 1% per year over the same time period.”
So why do so many Americans feel worse off? Sacerdote hypothesizes,
First, I am only examining consumption within very large sections of the income distribution and there may be specific groups (for example less than high school educated men) for whom consumption is actually falling. Second, it’s possible that the quality of some services such as public education or health care could be falling for some groups. Third, the rise in income inequality coupled with increased information flow about other people’s consumption may be making Americans feel worse off in a relative sense even if their material goods consumption is rising. Fourth, changes in family structure (e.g. the rise of single parent households) , increases in the prison population, or increases in substance addiction could make people worse off even in the face of rising material wealth. A deep future research agenda would be to understand how America has lost its sense of optimism about living standards and whether the problem is one of consumption, relative consumption (relative to other people) or something entirely different.
On top of this, Harvard’s Martin Feldstein points out that innovation and new products are often ignored when measuring economic growth and the state of living standards:
Ignoring the introduction of new products is therefore a serious further source of understating the real growth of output, incomes, and productivity. New products and services are potentially valuable in themselves and are also valued by consumers because they add to the variety of available options. In an economy in which new goods and services are continually created, their omission in the current method of valuing aggregate real output makes the existing measure of real output even more deficient and more of a continually increasing underestimate of true output. Hulten (2015) summarizes decades of research on dealing with new products done by the Conference on Research in Income and Wealth with the conclusion that “the current practice for incorporating new goods are complicated but may miss much of the value of these innovations.” …[T]he official statistics ignore the very substantial direct benefit to consumers when new products and services become available, causing an underestimate of the rate of increase in real output and an overestimate of the corresponding price index…The failure to take new products into account in a way that reflects their value to consumers may be an even greater distortion in the estimate of real growth than the failure to reflect changes in the quality of goods and services. There is no way to know (pgs. 11-12, 14).
Feldstein has made this argument before in more popular writing. A good number of economists agree. While growth in real wages could be better, it seems to be inaccurate to say that they have stagnated.
I’ve written about global income inequality inseveralpastposts. As Nathaniel and I wrote in SquareTwo a few years ago,
[W]ith the continual rise of the poor out of destitute poverty, it seems logical that global inequality would also be declining. Happily, recent evidence seems to supports the logic. As former World Bank economist Branko Milanovic put it, “[P]erhaps for the first time since the Industrial Revolution, there may be a decline in global inequality…For the first time in almost two hundred years—after a long period during which global inequality rose and then reached a very high plateau—it may be setting on a downward path.” Though cautious in his conclusions, Milanovic nevertheless finds that when population is factored into the data, the evidence demonstrates that the world became a “much better (“more convergent” or more equal) place” between 1980 and 2011. When country price levels (used to determine purchasing power) are factored in, a decline in global inequality can be seen over the past decade.
Several studies over the past few years have found that as the world poverty rates plummeted, so did global inequality. As one pair of researchers explains,
We can compute not only the world poverty rates and the poverty rates of any country or region, but also other statistics related to the distribution of income. For instance, we can compute the world gini coefficient, a measure of world inequality, for every year between 1970 and 2006. We show that world inequality measured by the gini fell from 67.6 to 61.2 (Figure 3), and similar declines in inequality can be shown for other inequality statistics, such as the mean logarithmic deviation, the Theil Index, and the Atkinson family of inequality indices.
While inequality is still high and increasing within countries, global inequality (between countries) has seen an unprecedented decline. “Even though the bulk of this decline is due to the performance of China and other Asian countries,” evidence shows “that a (weaker) declining trend survives even when these countries are excluded from the analysis.” Economist and Nobel laureate Friedrich Hayek noted that “after rapid progress has continued for some time, the cumulative advantage for those who follow is great enough to enable them to move faster than those who lead and that, in consequence, the long-drawn-out column of human progress tends to close up…[O]nce the rise in the position of the lower classes gathers speed, catering to the rich ceases to be the main source of great gain and gives place to efforts directed toward the needs of the masses. Those forces which at first make inequality self-accentuating thus later tend to diminish it.”
The above describes relative inequality. However, a more recent study shows that absolute inequality has increased.
As one of the researchers explains,
[T]ake the case of two people in Vietnam in 1986. One person had an income of US$1 a day and the other person had an income of $10 a day. With the kind of economic growth that Vietnam has seen over the past 30 years, the first person would now in 2016 have $8 a day, while the second person would have $80 a day. So if we focus on ‘absolute’ differences, inequality has gone up, while a focus on ‘relative’ differences suggests that inequality between these two people has remained the same.
Relative inequality indicators have been by far the most widely used in empirical economic analysis, but, based on economic theory and empirical evidence, it is far from clear that we should favour relative over absolute notions of inequality. The evidence suggests that many people do perceive absolute differences in incomes as being an important aspect of inequality (Amiel and Cowell 1992, 1999).
However, the authors concede,
Over the past 40 years, over one billion people around the world have been lifted out of poverty, driven largely by substantial growth in income in developing countries. While this growth has been accompanied by a striking rise in absolute inequality, it has also improved the lives of hundreds of millions of people. It is difficult to imagine how in practice such growth, and the associated poverty reduction, could have occurred without an increase in absolute inequality. There would be huge implications for the fight against global poverty if attempts were made to halt economic growth in order to appease absolute inequality. Instead, the policy emphasis should be on creating more inclusive growth with falling ‘relative’ inequality – these two goals are complementary.
Is it true, though, that it’s “far from clear that we should favour relative over absolute notions of inequality”? For example, most studies favor absolute poverty over relative poverty. Could the same case be made for absolute inequality? I’m not so sure. Branko Milanovic, one of the leading scholars on income inequality, provides the following reasons for preferring relative measurements in regards to inequality:
Conservatism: “[R]elative income measures are conservative because they show no change in in equality in cases where absolute measures would show an increase (when all incomes go up by the same percentage) or a decrease (when they all go down by the same percentage). On in equality, which is a topic of considerable moral and political importance, and at times a very inflammatory topic indeed, we do not want to err in the direction of inflaming it further. Conservatism (in terms of measurement, not necessarily in terms of policy) is to be preferred.”[ref]Milanovic, Global Inequality: A New Approach for the Age of Globalization (Cambridge, MA: The Belknap Press of Harvard University Press, 2016), 27.[/ref]
Precision: “Think of the distribution as a balloon. As the balloon expands, the absolute distance between the points on the balloon increases. Focus on absolute distances presents the disadvantage that practically every increase in the mean (blowing up the balloon) could be judged to be pro-inequality. We would lose the sharpness with which we can currently distinguish between pro-poor and pro-rich growth episodes.”[ref]Ibid.[/ref]
Relative Growth: “Growth is simply the relative increase in the first moment, and in equality is the relative increase in the second moment. The measures that we use to assess success or failure in economic development (relative change in GDP per capita) should be related to the measures we use to assess success or failure in distribution of resources (relative change in a measure of inequality). Focus on the absolutes in growth, as in inequality, would lead us to nearly always find that growth in rich countries, however small in percentage terms, would be greater than growth in poor countries, however huge. If the United States grew by 0.1 percent per capita annually, that growth would increase the absolute GDP per capita of each American by about $500, which is more than the GDP per capita of many African nations. Should we then deem Congo, in any given year, to have been as successful as the United States only if it doubles its per capita income— a feat that no human community has ever achieved in recorded history? So the logic of relativity that applies to growth should also apply to inequality.”[ref]Ibid., 28.[/ref]
Personal Utility: “[F]or a person whose income is $10,000 to experience the same increase in welfare as a person whose income is $1,000, the absolute income gain ought to be ten times greater. In other words, one additional dollar will yield less utility, or seem less important, to a rich person than to a poor person. If we think that this is a reasonable assumption, we can then also interpret the data given in the growth incidence curve as changes in utility: an 80 percent income increase around the global median adds to the utility of people there more than a 5 to 10 percent increase in real income adds to the utility of the lower middle classes in rich countries (even if the absolute dollar gains of the latter may be larger). By this route too, we come to the conclusion that relative income changes are a more reasonable metric than absolute income changes.”[ref]Ibid., 29.[/ref]
While absolute measures in inequality may have their use, relative measures do a better job of complementing analyses of growth and poverty. In short, relative inequality provides a better framework by which to gauge standards of living.
 In Scotland, students exercised complete consumer control over with whom they studied and which subjects they deemed relevant. Oxford—and in fact most other European universities—employed a system similar to the way that American universities handle tuition payments today: One tuition payment was made directly to the university, and the university decided how to distribute what came in…Smith points out how [Oxford] often fell short of the Scottish system, where direct payment of fees served as motivation for faculty responsibility. “The endowments of [British] schools and colleges have necessarily diminished more or less the necessity of application in the teachers,” Smith writes in his opening sally against bundling the costs of education. “In the university of Oxford, the greater part of the publick professors have, for these many years, given up altogether even the pretence of teaching.” In the the Scottish system, “the salary makes but a part, and frequently but a small part of the emoluments of the teacher, of which the greater part arises from the honoraries or fees of his pupils,” he explains.
 One of the more encouraging findings [of one study] was that, even in the face of some of life’s most tragic events like the death of a spouse, after a few years, people do recover to the same level of wellbeing they had before their spouse passed away. But this was not the case for those who were unemployed for a prolonged period of time — particularly not for men. Our wellbeing actually recovers more rapidly from the death of a spouse than it does from a sustained period of unemployment. This doesn’t mean that getting fired will harm your wellbeing forever. The same study also found that being laid off from a job in the last year did not result in any significant long-term changes. The key is to avoid sustained periods of unemployment (more than a year) when you are actively looking for a job but unable to find one. In addition to the obvious loss of income from prolonged unemployment, the lack of regular social contact and the daily boredom might be even more detrimental to your wellbeing.