Give Cash, Not Clothes

If you want to help after a disaster, that is. “As a researcher with the Harvard Humanitarian Initiative,” writes Julia Brooks,

…I’ve seen the evidence on dozens of disasters, from Superstorm Sandy to the South Asian Tsunami. It all points to a clear conclusion: In-kind donations of items such as food, clothing, toiletries and diapers are often the last thing that is needed in disaster-affected areas.

Delivering things that people need on the ground simply doesn’t help disaster-struck communities as much as giving them – and relief organizations – money to buy what they need. What’s more, truckloads of blue jeans and cases of Lunchables can actually interfere with official relief efforts.

If you want to do the greatest good, send money.

How so?

While ostensibly free, donated goods raise the cost of the response cycle: from collecting, sorting, packaging and shipping bulky items across long distances to, upon arrival, reception, sorting, warehousing and distribution.

Delivering this aid is extremely tough in disaster areas since transportation infrastructure, such as airports, seaports, roads and bridges, are likely to be, if not damaged or incapacitated by the initial disaster, already clogged by the surge of incoming first responders, relief shipments and equipment.

At worst, disaster zones become dumping grounds for inappropriate goods that delay actual relief efforts and harm local economies.

After the 2004 South Asian tsunami, shipping containers full of ill-suited items such as used high-heeled shoes, ski gear and expired medications poured into the affected countries. This junk clogged ports and roads, polluting already ravaged areas and diverting personnel, trucks and storage facilities from actual relief efforts.

After the 2010 earthquake in Haiti, many untrained and uninvited American volunteers bringing unnecessary goods ended up needing assistance themselves.

In-kind donations often not only fail to help those in actual need but cause congestion, tie up resources and further hurt local economies when dumped on the market, as research from the International Federation of Red Cross and Red Crescent Societies determined.

Research confirms that a significant portion of aid dispatched to disaster areas is “non-priority,” inappropriate or useless.

One study led by José Holguín-Veras, a Rensselaer Polytechnic Institute expert on humanitarian logistics, found that 50 percent to 70 percent of the goods that arrive during these emergencies should never have been sent and interfere with recovery efforts. After the 2011 Joplin, Missouri tornado and the Tōhoku, Japan earthquake, for example, excessive donations of clothing and blankets tied up relief personnel. The situation was similar after Hurricane Katrina.

Relief workers consider these well-meaning but inconvenient donations as a “second tier disaster” due to the disruption they cause.

What’s more is that “emerging evidence suggests that disbursing cash is often the best way to help people in disaster zones get the food and shelter they need. What’s more, the World Food Program and the UN High Commissioner for Refugees say that people affected by disasters tend to prefer cash over in-kind aid due to the dignity, control and flexibility it gives them.”

This drives home the point that good intentions are not enough: evidence of effectiveness is necessary.

Land-Use Restrictions and the Economy

A brand new NBER working paper confirms what past evidence has shown: land-use restrictions tend to have negative effects on the economy. The researchers conclude,

Image result for land-use restrictionsHistorically, U.S. economic growth has gone hand-in-hand with the regional reallocation of labor and capital. The pace of resource reallocation, however, has slowed considerably. This decline has roughly coincided with lower productivity and output growth, as well as growing home price premia in high income states, including California and New York.

This paper develops a theory of these observations based on land-use regulations. We analyzed how policies that restrict land-use have affected resource reallocation, aggregate output and productivity, and regional employment shares.

We constructed a multi-region model economy in which regions differ by their productivity, their amenities, their urban land stock, and land-use regulations. We develop a procedure that uses the model together with data on land acreage, regional employment shares, and regional labor productivities to identify time series of regional TFP, amenities, and to systematically construct a time series of land-use regulations, which has been missing from the literature. Our model-inferred TFP, amenities, and land-use regulations compare fairly closely with independent measures of state-level regulations and quality of life measures.

We find that reforming land-use regulations would generate substantial reallocation of labor and capital across U.S. regions, and would significantly increase investment, output, productivity, and welfare. The results indicate that too few people are located in the highly productive states of California and New York. In particular, we find that deregulating just California and New York back to their 1980 land-use regulation levels would raise aggregate productivity by as much as 7 percent and consumption by as much as 5 percent. The results suggest that relaxing land-use restrictions may contribute significantly to higher aggregate economic performance (pg. 40).

They explain “that even modest land-use deregulation leads to a substantial reallocation of population across the states, with California’s population growing substantially. We also find that economy-wide TFP, output, consumption, and investment would be significantly higher as a consequence of deregulation. We find that U.S. labor productivity would be 12.4 percent higher and consumption would be 11.9 percent higher if all U.S. states moved halfway from their current land-use regulation levels to the current Texas level. Much of these gains reflect general equilibrium effects from the policy change. In particular, roughly half of the output and welfare increases reflect the substantial reallocation of capital across states” (pg. 4).

Mobility and Growth at the Top and Bottom

“While income trends in such groups are often referred to as growth rates of the ‘rich’ or the ‘poor’,” write the authors of a new paper,

an underappreciated point is that membership in these groups is far from stable over time. When there is mobility in the income distribution, over time some of the initially poor will rise out of the bottom 40%, while others will fall from the top 60% into the bottom 40%. The same is true at the top end, with some fortunate individuals ascending into the top 10% while others drop out of this group.

This has consequences for how to interpret trends in group average incomes. For example, the policy implications, and even the political acceptability, of a given change in average income in the top 1% of the income distribution depends crucially on whether this group of top earners consists of the same people over time, or instead whether some of the initially rich fall out of the top group and are replaced with those who were initially poorer. This distinction matters just as much at the lower end of the income distribution. For example, when evaluating interventions designed to benefit those starting out at the bottom 10% of the income distribution, it is of considerable policy importance to be able to track the same group of individuals over time, and particularly to be able to track the experiences of those who were able to increase their incomes sufficiently to rise out of the bottom 10%.[ref]This has been pointed out by others using various datasets.[/ref]

The authors, in turn,

use data from the World Income and Wealth database, which is derived from published summaries of income tax records to measure average incomes and top income shares in a sample of mostly advanced economies, as well as the World Bank’s PovcalNet database, which reports data on average incomes and summary measures of inequality based on household surveys for a large number of mostly developing countries. Some of the cross-country patterns we observe in estimates of income mobility seem quite plausible given our priors. For example, among the high-income countries, the Scandinavian countries and much of Europe show relatively high levels of income persistence, while the US, Singapore, and Taiwan rank among the countries with low levels of income persistence.

To illustrate the consequences of mobility for growth rates of group average incomes for each country in our dataset, we take the latest available ten-year period and compute the conventionally available anonymous growth rate of average incomes for the top 10% (for countries in the World Income and Wealth database) and bottom 40% (for PovcalNet countries) of the income distribution. We then compare these to estimates of the corresponding non-anonymous growth rates obtained using our approach.

…In the case of the bottom 40%, the non-anonymous growth rate is considerably higher than the corresponding anonymous growth rate (the World Bank’s measure of ‘shared prosperity’). The difference is economically significant, averaging about 3% per year. This gap reflects the fact that the non-anonymous growth rate captures the experience of those who started out in the bottom 40% but had faster-than-average growth and thus rose out of the bottom 40% by the end of the period over which the growth rate is calculated. Conversely, the anonymous growth rate is lower because it reflects the experience of those who started out above the 40th percentile but had slower-than-average growth and thus fell back into the bottom 40%. Putting these observations together, this means that by tracking shared prosperity anonymously, policymakers could inadvertently overlook the success of some initially poor individuals. Or more succinctly, those who start out poor on average grow faster than you might think based on commonly reported anonymous growth rates.

The exact opposite holds true when tracking growth at the top end of the income distribution…As a result, commonly available anonymous growth rates of top incomes exaggerate the fortunes of the rich, often by a considerable margin. Or more succinctly, those who start out rich grow more slowly than you might think based on anonymous growth rates.

Important stuff.


Adjusted U.S. Income Inequality

Image result for income inequality

A 2016 working paper explores the well-tread topic on income inequality, but with proper adjustments. These include:

  • Remove non-deductible losses before 1987
  • Include tax-exempt interest
  • Remove filers  younger than 20 years old and remaining dependent filers
  • Remove non-resident filers
  • Correct number and income of non-filers
  • Correct for income sources
  • Include C corporation retained earnings
  • Include C corporation taxes
  • Include employer payroll taxes
  • Include employer provided health insurance
  • Measure income group sizes using the number of adults
  • Include Social Security benefits
  • Include unemployment insurance benefits
  • Include other cash transfers
  • Include Medicare
  • Include other non-cash transfers

When all is said and done, the researchers conclude,

Using unadjusted tax-based measures, Piketty and Saez (2003 and updates) estimate that between 1960 and 2013 top one percent pre-tax income shares increased by 10.0 percentage points. Using a consistent market income measure results in an increase of only 2.8 percentage points. Using a broad income measure with government transfers results in an increase of only 0.8 percentage points. Compared to unadjusted top one percent income shares, broad income shares were about 4 percentage points larger in the 1960s due to the inclusion of corporate retained earnings and taxes. They were about 5 percentage points lower in recent decades due to controlling for lower marriage rates outside the top of the distribution and including employer provided health insurance and government transfers. These differences illustrate how unadjusted tax-based income measures can present a distorted picture of inequality, as income sources outside the individual tax system can strongly impact inequality trends (pg. 14).

Immigrant Integration: European Edition

I’ve written before about how strict labor laws in Europe may be hindering immigrant integration. While I still think these may be barriers to integration, Europe is doing better than is often reported. As Tyler Cowen explains in Bloomberg,

Debates over immigration are fraught with misconceptions. One of the most common is that the integration of Muslims into societies in Western Europe has gone very badly, in large part because terror attacks loom so large in the news. Those attacks are a very real problem, yet they do not reflect the typical reality. A new study from the Bertelsmann Stiftung in Germany shows that Muslim integration in Europe is in fact proceeding at a reasonable pace.

The survey included more than 1,000 Muslims in Germany and about 500 in Austria, France, Switzerland and the U.K. (both immigrants and children of immigrants were included, though not recent refugees). Although this is hardly the first study of its kind, the results offer considerable hope for societies facing integration challenges: The stereotype of an uneducated, unemployed, easily radicalized Muslim migrant does not fit the facts.

The first sign of integration is language skill. About three-quarters of the Muslims born in Germany report German as their first language; 46 percent of foreign-born Muslims do. Overall, language skills improve with each generation, and migrants seem to be resourceful in finding ways to learn an adopted country’s tongue. Muslims immigrants to France and the U.K. often arrive knowing the languages of their new countries.

Only about one in 10 French Muslims report leaving school before age 17; the American high school graduation rate for all attendees is lower, at 83 percent. In Germany, employment for Muslim immigrants is on a par with employment for non-Muslims, though Muslim wages are lower. The rate of unemployment for French Muslims is a disappointing 14 percent, but that looks less troubling when you consider that migrants are relatively young and French youth unemployment as a whole is about 25 percent. Labor market reforms and better economies can help integrate foreign migrants, and Europe is currently showing decent economic growth, again reasons for hope.

Nor do Muslims huddle in Muslim-only communities, apart from the broader population. Some 87 percent of Swiss Muslims report having frequent or very frequent social contact with non-Muslims. In both Germany and France that number is 78 percent, again a sign of assimilation. It is lower in the U.K. (68 percent) and Austria (62 percent), but even those figures show plenty of social intermingling. And migrants across countries report feeling a close connection to the countries they live in, from a high of 98 percent (Switzerland) to a low of 88 percent (Austria).  

Cowen continues,

The study also suggests that integration works better when the migrants are relatively numerous, perhaps because they can create mutual support services. But making that point is unlikely to win many European elections…The good news is that Western European integration of Muslims is further along than many people believe. The bad news is that the process of integration entails significant social change and change sometimes brings turmoil. The human race is improving at this broader challenge only slowly.

Father Loss at the Cellular Level

Image result for father sonPrinceton molecular biologist Daniel Notterman and colleagues published a new article in Pediatric titled “Father Loss and Child Telomere Length.” According to the IFS blog,

Research tells us that father loss is linked to a broad range of negative outcomes for children, including lower rates of high school and college graduation, a higher risk of delinquency, early sexual activity, teen pregnancy, and poor mental, physical, and emotional health. Yet despite the emerging science of fatherhood, in many ways, we are only beginning to understand the significance of the biological father connection to child well-being. New research indicates that the repercussions of losing a biological father—whether to death, divorce, or incarceration—go even deeper, affecting children at the cellular level.

Notterman explains these new findings in an interview with IFS:

Telomere length (TL) has been shown in many studies to be associated with chronic stress of diverse origins in both children and adults. We reasoned that separation or loss of a father would be a significantly stressful event in the life of a young child. If that were the case, we hypothesized that father loss would be associated with telomere attrition, and that turned out to be the case. We know that chronic stress is also associated with long-term adverse effects on health, including cardiovascular and behavioral health. Whether accelerated telomere attrition is just a biomarker of these subsequent health effects, or actually plays a causal role in producing these effects is not known at present, but it is the subject of intense laboratory and clinical study. In either case, by examining telomere length, we get an early window (by age 9 years in our study) into adverse health effects that may not be realized for many years.

…Father loss was conceptualized as being of one of three types: separation of the biologic father from the child’s mother, often due to the dissolution of their relationship; incarceration of the child’s father; and death of the father before the child was 9 years of age. In addition to the associations noted in the question, we also found evidence of genetic moderation. Due to the presence of specific gene variants (called, “alleles”) in a gene called “SERT,” which is known to affect how the brain processes serotonin, a key neurotransmitter, some children seem to be more sensitive to environmental stimuli such as loss of a parent. In our study, children bearing a sensitizing allele, or variant, or SERT are much more susceptible to telomere shortening. Thus, the magnitude of telomere shortening is affected not only by the loss of a father but also by the genetic endowment received from the parents.

The death of a father is “a more potent stress because it completely ends the relationship between father and child. With separation and incarceration, it is still possible for there to be contact between father and child. Fathers who are separated from the family often maintain contact with a biological child, and incarceration may be limited in time.” And while the effects of father loss were greater for boys than girls (possibly due to fahters providing “specific role-modeling to sons”), the “study was not specifically designed to answer this question.”

Income associated with the father is a major player in one form of father loss, but less in others:

We found that father loss due to the dissolution of the relationship with the child’s mother affects telomere length mainly by reducing family income. We conjecture that this is due to the stress engendered by material hardship (worsening poverty). Father loss due to incarceration or death seems to be a much more potent stress, such that the additional contribution of income loss is relatively small.

In summary,

We think that our findings reinforce the growing understanding of a father’s importance in the life of his children. We do not think that our data support a conclusion that one type of relationship between a child’s parents is more favorable than another; rather, we conclude that a central role for the father is optimal for his child’s well-being. Furthermore, we think that this knowledge should inform public policy in providing support to families and children where the father, for one reason or another, is absent from his children.


Opioid Use and the Labor Force

Image result for opioid prescription

According to a new Brookings paper by Princeton economist Alan Krueger, “The increase in opioid prescriptions from 1999 to 2015 could account for about 20 percent of the observed decline in men’s labor force participation (LFP) during that same period.” Other findings include:

  • Regional variation in opioid prescription rates across the U.S. is due in large part to differences in medical practices, rather than varying health conditions. Pain medication is more widely used in counties where health care professionals prescribe greater quantities of opioid medication, with a 10 percent increase in opioid prescriptions per capita is associated with a 2 percent increase in the share of individuals who report taking a pain medication on any given day. When accounting for individuals’ disability status, self-reported health, and demographic characteristics, the effect is cut roughly in half, but remains statistically significant.
  • Over the last 15 years, LFP fell more in counties where more opioids were prescribed. Krueger reaches this conclusion by linking 2015 county-level opioid prescription rates to individual level labor force data in 1999-2001 and 2014-16. For more on the relationship between prescription rates and labor force participation rate on the county-level, visit these maps.

Krueger also found that “nearly half of prime age men who are not in the labor force take pain medication on a daily basis, and that two-thirds of those men—or about 2 million—take prescription pain medication on a daily basis.” Furthermore, “two-thirds of men not in the labor force and taking pain medication used Medicaid, Medicare, or Veterans Affairs health insurance to purchase prescription pain medication, with the largest group relying on Medicaid.” In short, “Krueger’s analysis reinforces past research in finding that the overall decline in LFP since 2007 is primarily due to an aging population and ongoing trends that preceded the recession, for example increased school enrollment of young workers.”

Check it out.

Who Is More Socially Connected?

“Social capital,” according to the Greater Good Science Center,

refers to family and friends who support you through difficult times, as well as neighbors and coworkers who diversify your network and expose you to new ideas. While social capital originally referred to face-to-face interaction, it now also accounts for virtual interactions online such as email or on social media platforms like Facebook, Instagram, Twitter, and LinkedIn.

Social capital also includes the rewards these social connections yield, such as the feelings of bonding and belonging felt in close friendship, and the expanded worldview you might get from looser, broader connections. And these benefits trickle down to many parts of life; social capital is associated with happiness, better job prospects, cardiovascular health, and positive health-seeking behavior. Among seniors, social capital has been linked to physical mobility and tends to reduce cognitive decline.

Last year, GGSC put out a social capital quiz, asking “readers questions about how connected they feel to a larger community, whether they have someone to turn to in times of need, and how open and curious they are about new people, places, and things—both in-person and online. In reviewing the data, we calculated an overall social capital score, in-person social capital score, and online social capital score for each responder, and we looked at the trends among everyone who took the quiz.” Here’s what they found:

  • Young and old have less social capital than those in between.
  • Ethnicity did not affect social capital scores.
  • More education was linked to higher social capital.
  • People in big cities had higher social capital.
  • People on the West Coast had higher social capital.
  • Liberals might have more social capital than conservatives.

Check out the article for further details.


The Origins of Formal Segregation Laws

Image result for segregation

A new NBER paper looks at the decline in collective action promoting segregation and the rise of formal laws enforcing it. From the ungated version:

The goal of the analysis is to identify which of the two channels (i.e., increases in black housing demand and/or reductions in white vigilante activity) actually drove demand for passage of municipal segregation ordinances. Although our data and estimating strategies are limited, the patterns we observe are consistent with the predictions of the model, though the evidence for the vigilante channel is stronger than for the housing demand channel. In particular, whether we use city-level or ward-level data, we find only mixed evidence that demand for segregation ordinances is strongest in areas with the fastest growing black populations.

By contrast, we find relatively strong and robust evidence for the second channel involving white vigilante activity. Across a variety of model specifications and different measures of white vigilante activity, it is clear that in the cities where whites were able to police color lines and punish deviations through private channels, there was relatively little demand for segregation ordinances. For example, the data show that in cities located in counties with high lynching rates (a direct indicator of the ability of whites to organize privately to punish blacks for violating established racial norms) the probability of passing a segregation ordinance is significantly lower than in places with low lynching rates. Similarly, cities that possessed a robust volunteer fire department (an alternative measure of the ability to provide public goods through private channels) are significant less likely to pass a segregation ordinance. We supplement our city-level analysis with ward level data from St. Louis. With the ward-level data from St. Louis, we can identity which wards were the strongest supporters of the city’s segregation ordinance. The patterns observed in St. Louis suggest that support for the city’s segregation ordinance was strongest in the wards where it was difficult for white communities to coordinate private vigilante activity (pg. 4-5).

The authors conclude,

The existing literature on the origins of municipal segregation ordinances argues that segregation ordinances were passed largely because of rapidly growing black populations in urban areas and variation in the intensity anti-black preferences across cities. Our results suggest the existing literature needs to be revised. While there is evidence that growing black populations might have played a role in the propagation of segregation ordinances, the results here suggest that a decline in the ability of whites to provide a local public good (i.e. segregation) through private vigilante activity was especially important. In particular, the negative coefficient on lynching and the positive coefficients on white population growth are consistent with the hypothesis that segregation ordinances were passed in those cities where it was becoming increasingly difficult for whites to organize and punish blacks for violating established color lines in residential housing markets.

More generally, the model developed and tested here has broad implications for our understanding of residential segregation the processes that give rise to it. Of particular interest is the exploration of how market processes such as tipping interact with institutional change. While prior research has tended to treat market-related processes such as tipping independently from institutions, both formal and informal, the framework here integrates them. In the process, it can help us understand political institutions and market processes work together to drive segregation and make it persistent (pg. 34-35).

More Economic Illiteracy from Journalists

I’ve lamented about this before. Funny enough, it was largely about the same source: The Guardian. A recent piece suggests that “neoliberalism” is responsible for, in the words of Forbes‘ Tim Worstall, the destruction of “everything that is good and holy about society.” This is based on a new IMF study that reviews the following:

Our assessment of the agenda is confined to the effects of two policies: removing restrictions on the movement of capital across a country’s borders (so-called capital account liberalization); and fiscal consolidation, sometimes called “austerity,” which is shorthand for policies to reduce fiscal deficits and debt levels. An assessment of these specific policies (rather than the broad neoliberal agenda) reaches three disquieting conclusions:

•The benefits in terms of increased growth seem fairly difficult to establish when looking at a broad group of countries.­

•The costs in terms of increased inequality are prominent. Such costs epitomize the trade-off between the growth and equity effects of some aspects of the neoliberal agenda.­

•Increased inequality in turn hurts the level and sustainability of growth. Even if growth is the sole or main purpose of the neoliberal agenda, advocates of that agenda still need to pay attention to the distributional effects.­

In other words, it worries about financial openness and austerity. However, The Guardian describes it as such:

Three senior economists at the IMF, an organisation not known for its incaution, published a paper questioning the benefits of neoliberalism. In so doing, they helped put to rest the idea that the word is nothing more than a political slur, or a term without any analytic power. The paper gently called out a “neoliberal agenda” for pushing deregulation on economies around the world, for forcing open national markets to trade and capital, and for demanding that governments shrink themselves via austerity or privatisation. The authors cited statistical evidence for the spread of neoliberal policies since 1980, and their correlation with anaemic growth, boom-and-bust cycles and inequality.

Unfortunately for the author, that’s not quite accurate. The IMF researchers actually say,

There is much to cheer in the neoliberal agenda. The expansion of global trade has rescued millions from abject poverty. Foreign direct investment has often been a way to transfer technology and know-how to developing economies. Privatization of state-owned enterprises has in many instances led to more efficient provision of services and lowered the fiscal burden on governments.­

Perhaps The Guardian author needs to be reminded that the IMF came out against protectionism last year in the midst of anti-trade rhetoric from politicians. Similarly, it released a report around the same time extolling the benefits of trade. Furthermore, the new IMF study qualifies its concerns:

The link between financial openness and economic growth is complex. Some capital inflows, such as foreign direct investment—which may include a transfer of technology or human capital—do seem to boost long-term growth. But the impact of other flows—such as portfolio investment and banking and especially hot, or speculative, debt inflows—seem neither to boost growth nor allow the country to better share risks with its trading partners (Dell’Ariccia and others, 2008; Ostry, Prati, and Spilimbergo, 2009). This suggests that the growth and risk-sharing benefits of capital flows depend on which type of flow is being considered; it may also depend on the nature of supporting institutions and policies.­

…In sum, the benefits of some policies that are an important part of the neoliberal agenda appear to have been somewhat overplayed. In the case of financial openness, some capital flows, such as foreign direct investment, do appear to confer the benefits claimed for them. But for others, particularly short-term capital flows, the benefits to growth are difficult to reap, whereas the risks, in terms of greater volatility and increased risk of crisis, loom large.­

This doesn’t strike me as a denunciation of “neoliberalism.” I’m going to follow Worstall’s lead on this one and refer to Max Roser’s work.

Roser explains,

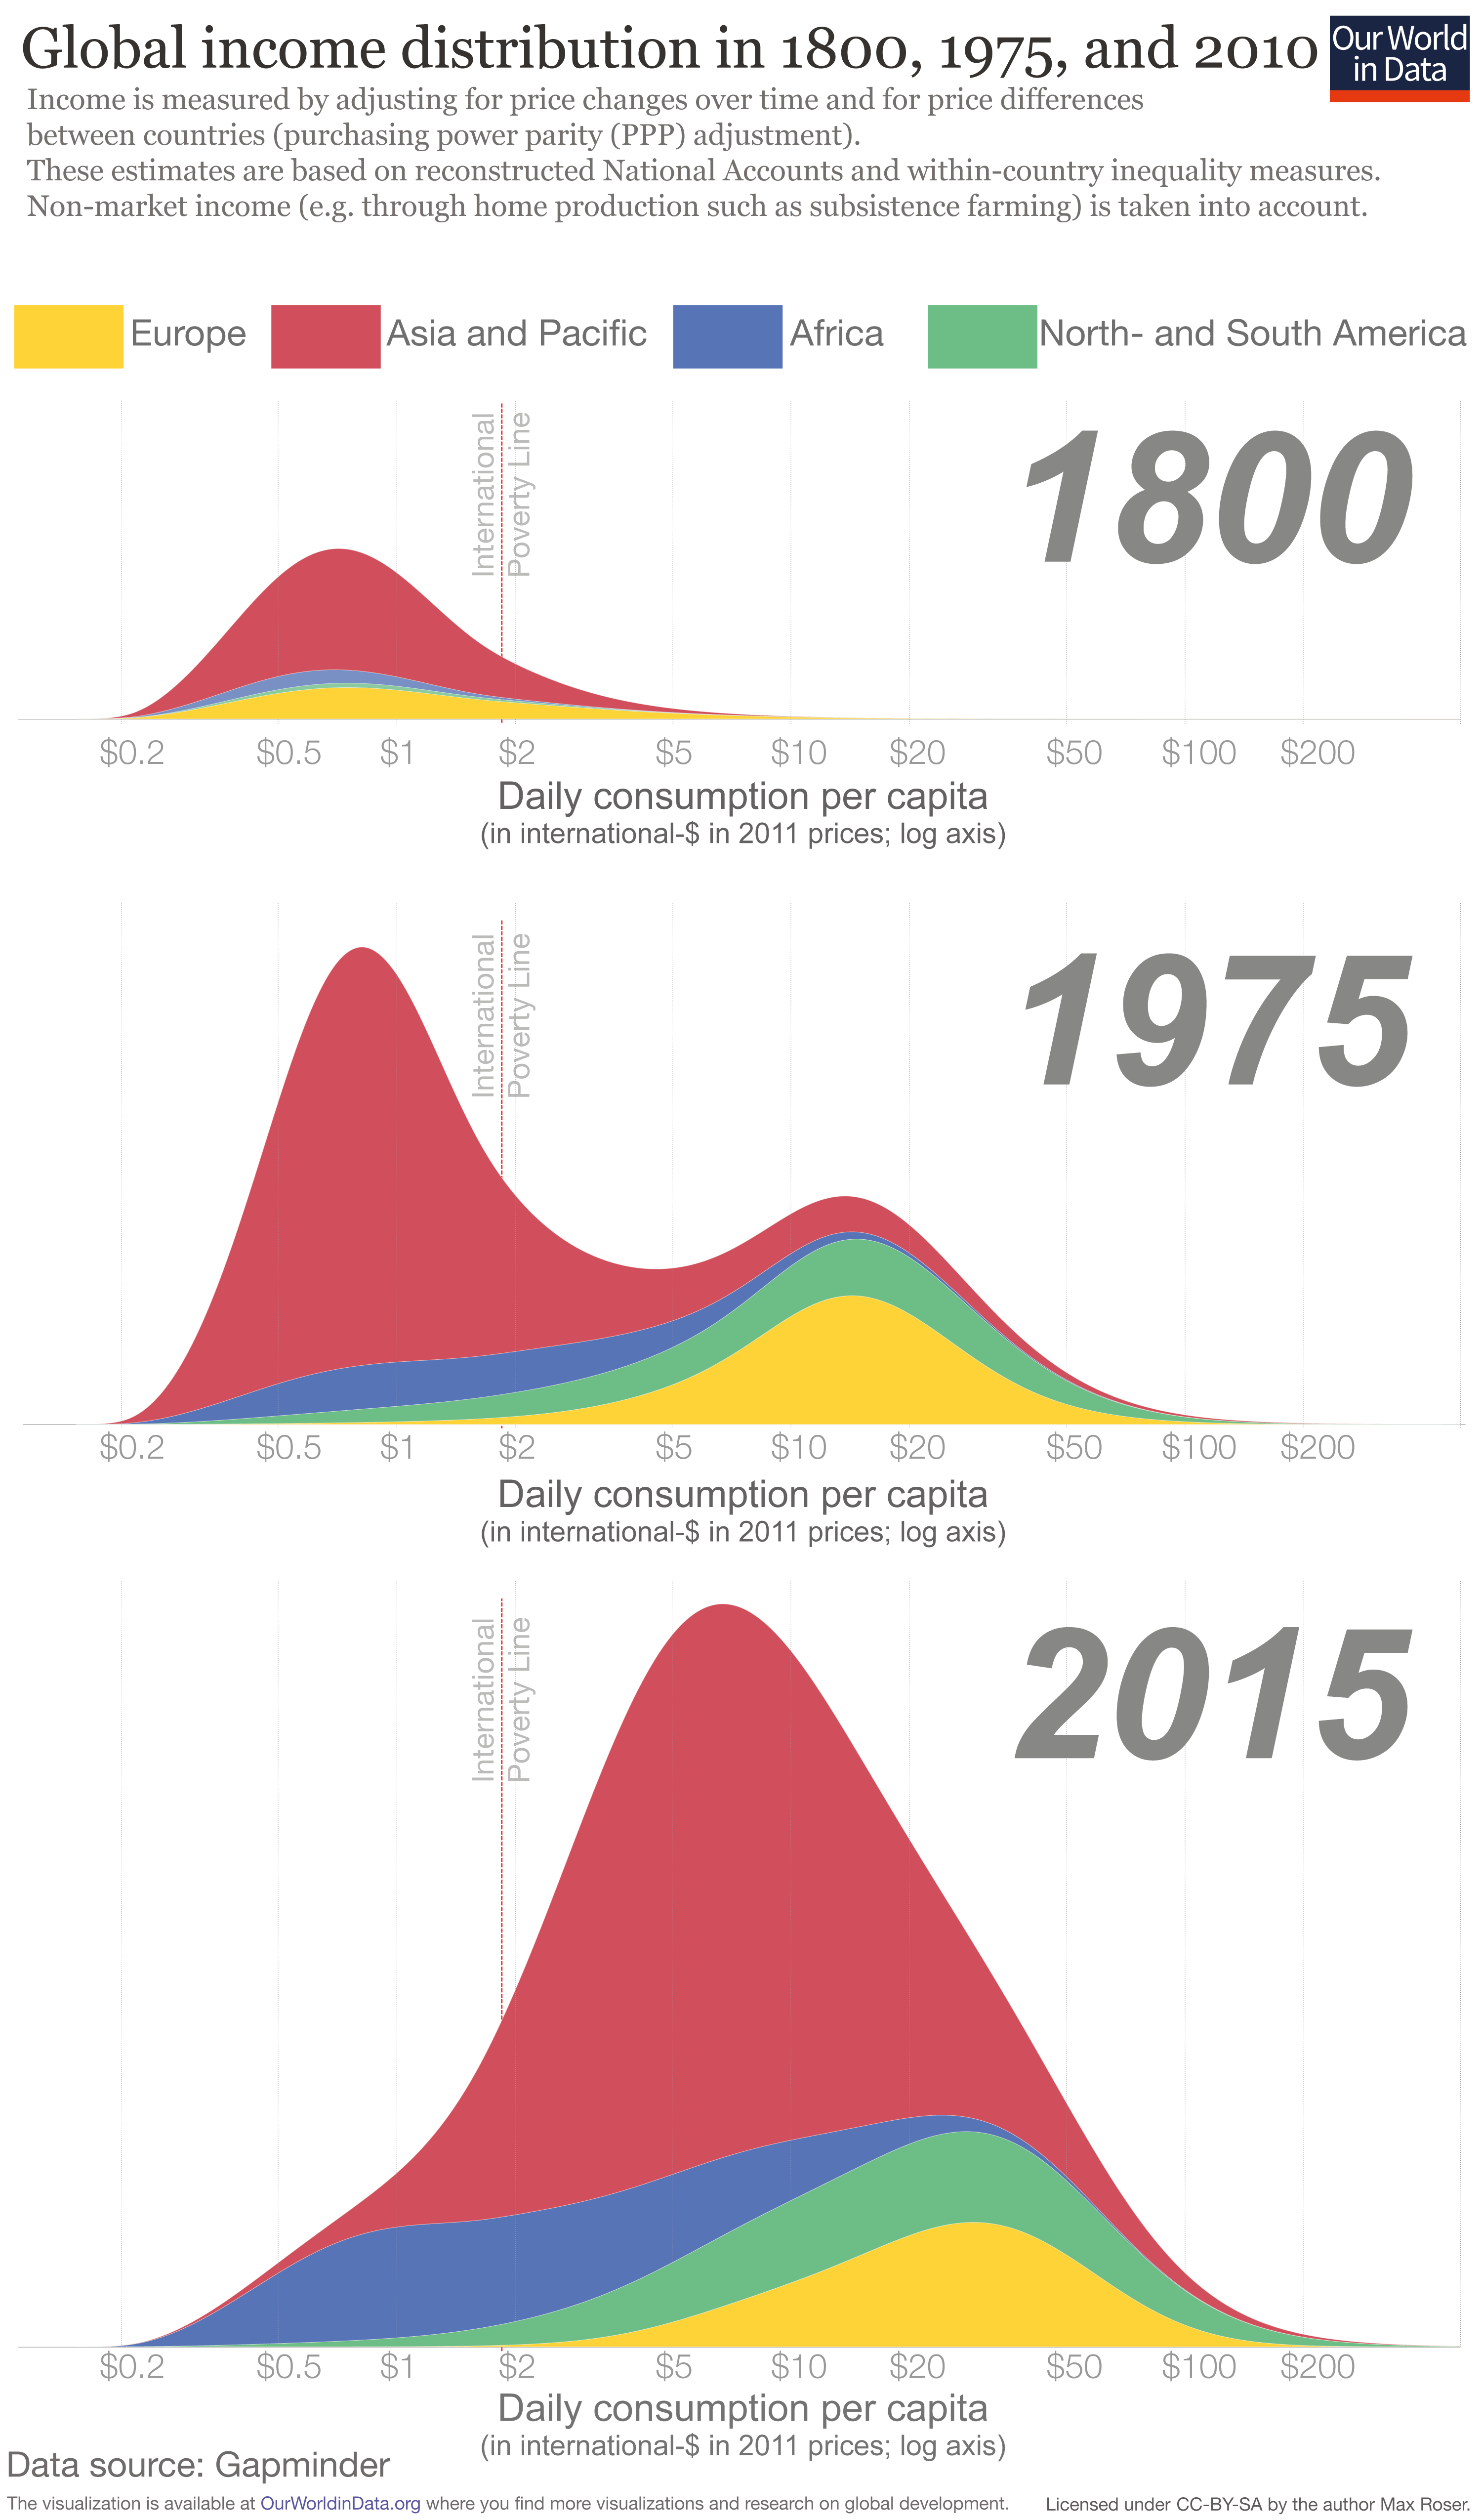
The distribution of incomes is shown at 3 points in time:

  • In 1800 only few countries achieved economic growth. The chart shows that the majority of the world lived in poverty with an income similar to the poorest countries in today. Our entry on global extreme poverty shows that at the beginning of the 19th century the huge majority – more than 80% – of the world lived in material conditions that we would refer to as extreme poverty today.

  • In the year 1975, 175 years later, the world has changed – it became very unequal. The world income distribution has become bimodal. It has the two-humped shape of a camel. One hump below the international poverty line and a second hump at considerably higher incomes – the world was divided into a poor developing world and a more than 10-times richer developed world.

  • Over the following 4 decades the world income distribution has again changed dramatically. The poorer countries, especially in South-East Asia, have caught up. The two-humped “camel shape” has changed into a one-humped “dromedar shape”. World income inequality has declined. And not only is the world more equal again, the distribution has also shifted to the right – the incomes of the world’s poorest citizens have increased and poverty has fallen faster than ever before in human history.

That’s right: global inequality is decreasing. The World Bank reports,

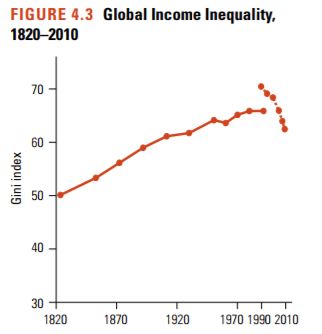
Globally, there has been a long-term secular rise in interpersonal inequality. Figure 4.3 shows the global Gini index since 1820, when relevant data first became available. The industrial revolution led to a worldwide divergence in incomes across countries, as today’s advanced economies began pulling away from others. However, the figure also shows that, in the late 1980s and early 1990s, the global Gini index began to fall. This coincided with a period of rapid globalization and substantial growth in populous poor countries, such as China and India.

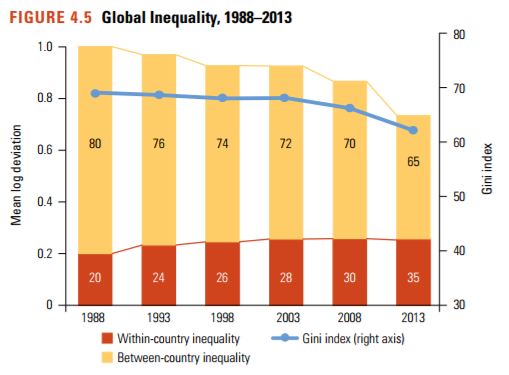
…Global inequality has diminished for the first time since the industrial revolution. The global Gini index rose steadily by around 15 Gini points between the 1820s and the early 1990s, but has declined since then (see figure 4.3). While the various methodologies and inequality measures show disagreement over the precise timing and magnitude of the decline, the decline since the middle of the last decade is confirmed across multiple sources and appears robust. The estimates
presented in figure 4.5 show a narrowing in global inequality between 1988 and 2013. The Gini index of the global distribution (represented by the blue line) fell from 69.7 in 1988 to 62.5 in 2013, most markedly since 2008 (when the global Gini index was 66.8). Additional exercises confirm that these results are reasonably robust, despite the errors to which the data are typically subject (pg. 76, 81).

Harvard’s Andrei Shleifer has shown that between 1980 and 2005, world per capita income grew about 2% per year. During these 2.5 decades, serious hindrances on economic freedom declined, including the world median inflation rate, the population-weighted world average of top marginal income tax rates, and the world average tariff rates. “In the Age of Milton Friedman,” summarizes Shleifer, “the world economy expanded greatly, the quality of life improved sharply for billions of people, and dire poverty was substantially scaled back. All this while the world embraced free market reforms” (pg. 126).

Go away Guardian.