The Effects of Climate Change on the U.S. Economy

Climate change could have massive negative effects on the U.S. economy according to a new study:

We exploited random fluctuations in seasonal temperatures across years and states, using the richness of historical data available in the US. We employed a panel regression framework with the growth rate of gross state product (GSP) and average seasonal temperatures for each US state, and found that summer and autumn temperatures have opposite effects on economic growth. An increase in the average summer temperature negatively affects the growth rate of GSP. An increase in the autumn temperature positively affects this growth rate, although to a lesser extent. This suggests that previous studies’ aggregation of temperature data into annual temperature averages may mask the heterogeneous effects of different seasons.

The summer effect is particularly pronounced in data since 1990. This leads to a negative net economic effect of rising temperatures. This implies that the US economy is still sensitive to temperature increases, despite the adoption of adaptive technologies such as air conditioning (Barreca et al. 2015). Temperature also has a stronger effect in states with relatively high summer temperatures, most of which are located in the south.

Our analysis quantified the effect of rising temperatures across sectors of the US economy. We find that an increase in average summer temperature has a pervasive effect on all industries, not just the sectors that are traditionally assumed to be vulnerable to climate change…In our empirical analysis, an increase in the average summer temperature decreased the annual growth rate of labour productivity. An increase in the average autumn temperature had the opposite effect. Our analysis used data at the macroeconomic level, but it is consistent with existing studies of this relationship at the microeconomic level (Zivin and Neidell 2014, Cachon et al. 2012, Zivin et al. 2015).

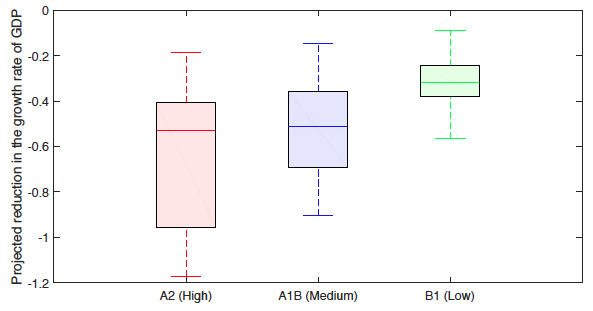
The authors find that the long-term effect of climate change would be a reduction in “the growth rate of US output by 0.2 to 0.4 percentage points by the end of the century. At the historical growth rate of US GDP of 4% per year, this would correspond to a reduction of up to 10%. The results are even more dramatic in the high emissions scenario (A2). Here, the reduction of economic growth could reach 1.2 percentage points, corresponding to roughly one-third of the historical annual growth rate of the US economy.”

You can see economist Bridget Hoffman explain the findings below:

These results echo Joseph Heath’s analysis of climate change’s effects on the global economy. But perhaps more important, it helps drive home his main point: climate change will drastically reduce economic growth over the next 100 years without intervention. But people will still be be significantly better off compared to us today even if we fail to act (check the GDP graph at about 0:46). They just won’t be as well off as they could have been.

Policy makers should consider both of these facts when discussing how to combat climate change.

Immigration and Prosperity

According to The New York Times,

President Trump on Wednesday began a sweeping crackdown on illegal immigration, ordering the immediate construction of a border wall with Mexico and aggressive efforts to find and deport unauthorized immigrants. He planned additional actions to cut back on legal immigration, including barring Syrian refugees from entering the United States.

Vox reports,

The four remaining draft orders obtained by Vox focus on immigration, terrorism, and refugee policy. They wouldn’t ban all Muslim immigration to the US, breaking a Trump promise from early in his campaign, but they would temporarily ban entries from seven majority-Muslim countries and bar all refugees from coming to the US for several months. They would make it harder for immigrants to come to the US to work, make it easier to deport them if they use public services, and put an end to the Obama administration program that protected young “DREAMer” immigrants from deportation.

In all, the combined documents would represent one of the harshest crackdowns on immigrants — both those here and those who want to come here — in memory.

Much like trade, I’ve spent the last year writing about the economics of immigration. Some of my findings are:

Sure enough, more evidence comes rolling in. A new IMF study finds

that migrants help increase per capita income levels in host advanced economies, and this effect is both statistically and economically significant. Our estimates suggest that a one percentage point increase in the share of migrants in the adult population (the average annual increase is 0.2 percentage point) can raise GDP per capita by up to 2% in the long run. Moreover, this effect comes mainly through an increase in labour productivity and, to a lesser extent, through the more standard channel of an increase in the ratio of working-age to total population.

The result survives a number of robustness checks, which include controlling for other determinants of income per capita (trade openness, the level of technology, the education level, and age structure of the host population, and policy variables); excluding from the sample countries that were created through migration and have high income levels (USA, Canada, Australia, and New Zealand); and using alternative gravity model-based instruments.

We find that both high- and low-skill migrants raise labour productivity. There is no evidence of major physical or human capital dilution, as investment adjusts over time to the larger pool of workers, and migrants are increasingly high-skilled. Instead, our results suggest that the complementarities that earlier analyses uncovered mostly at the micro level are also relevant at the macro level. The evidence from the microeconomic literature suggests that the positive productivity effects come from increased TFP and human capital. High-skilled migrants contribute to productivity directly, including through innovation, and indirectly through their positive spillovers on native workers. Low- and medium-skilled migrants can also contribute to aggregate productivity, to the extent that their skills are complementary to those of natives, promoting occupational reallocation and task specialisation.

…Our analysis finds…that the gains from immigration are broadly shared across the population. Migration increases the average income per capita of both the bottom 90% and the top 10% of earners, even though high-skilled migration benefits more top earners — possibly because of a stronger synergy between migrants and natives with high skills. Moreover, the Gini coefficient — a broad measure of income inequality within the bottom 90% of earners — is not affected by the migrant share.

Let them come.

All Trumped-Out

I couldn’t bring myself to include an image of Trump. So here’s Betty and her sloth.

I’ve been feeling Trumped-out since before the election, and I had hoped post election (perhaps naively even after he won) that the Trump obsession would dwindle to a hum. I’ve been dissapointed to say the least (please, Facebook, bring back memes about cats and tacos, I’ve had enough Trump.) I have, however, managed to come across some articles within the Trumpian madness that are actually worth the read.

First, from the NYT, an Italian confronts the similarities between Trump in America and their own media tycoon, Berlusconi, who was prime minister in Italy for a total of nine years. His suggestion on how to combat Trump: stick to policies, ignore the person (Please, ignore the person!).

Only two men in Italy have won an electoral competition against Mr. Berlusconi: Romano Prodi and the current prime minister, Matteo Renzi (albeit only in a 2014 European election). Both of them treated Mr. Berlusconi as an ordinary opponent. They focused on the issues, not on his character.

From the Cato Institute, a critique of Trump’s inaugural address, that ignores the style of the address and worries about the substance. The author notes that words indicating an adherence to or respect of the Constitution were missing.

Still, I wish the speech had used the word “Constitution,” or “law” in a way beyond the phrase “law enforcement,” or “Framers” or “Founders,” or “Declaration” or “Amendment” or “individual” or perhaps “rights.” The one occurrence of “right” was in a passage about “the right of all nations to put their interests first.”

From Politico, an indictment of journalistic temper tantrums that describes how journalism should behave (hint: let the facts speak for themselves, oh, and shut up about crowds (and tweets)), and recalls similar (though stylistically different) issues brought about by the Obama administration.

As I’ve hypothesized before, there is a method to Trump’s tweets. Whenever he finds the noose of news lowering over his thick orange neck, he takes to Twitter to change the subject. The more outrageous and self-serving (or should I say “self-dealing”?) the tweets are, the better his results…

Consider the Obama presidency. As former Politicos Jim VandeHei and Mike Allen wrote in 2013 in a piece titled, “Obama, the Puppet Master,” he was “a master at limiting, shaping and manipulating media coverage of himself and his White House.” … Obama, VandeHei and Allen explained, took “old tricks for shaping coverage (staged leaks, friendly interviews) and put them on steroids using new ones (social media, content creation, precision targeting).” In doing so, “Media across the ideological spectrum [were] left scrambling for access.”

And a, clearly biased, take on Betty White’s thoughts on the current political climate (it’s her birthday and I couldn’t find any less biased articles that focused on this point instead of the fact that she is 95!) from IJR.  Even if the article/headline is a stretch, I think Betty has great advice for all of us. Includes a video of Betty and her sloth doll (PS: my son got the same sloth for his birthday.)

I think that’s the time to buckle down and really work positively as much as you can. Instead of just saying, “This is terrible. He’s terrible.” Just think, “Alright, there’s nothing I can do about that right now but I can do the best in my little circle. So if I do that, maybe you’ll do your best and we’ll get through this.”


Education Levels, Not Income, Led to Trump

With it being Trump’s inauguration today, I thought I’d highlight an article from November by Nate Silver. Where did Clinton do well and where did she falter?:

I took a list of all 981 U.S. counties with 50,000 or more people and sorted it by the share of the population that had completed at least a four-year college degree. Hillary Clinton improved on President Obama’s 2012 performance in 48 of the country’s 50 most-well-educated counties. And on average, she improved on Obama’s margin of victory in these countries by almost 9 percentage points, even though Obama had done pretty well in them to begin with.

Yet, when he looks at “50 counties (minimum population of 50,000) where the smallest share of the population has bachelor’s degrees,” the tune changes considerably:

These results are every bit as striking: Clinton lost ground relative to Obama in 47 of the 50 counties — she did an average of 11 percentage points worse, in fact. These are really the places that won Donald Trump the presidency, especially given that a fair number of them are in swing states such as Ohio and North Carolina. He improved on Mitt Romney’s margin by more than 30 points (!) in Ashtabula County, Ohio, for example, an industrial county along Lake Erie that hadn’t voted Republican since 1984.

Silver continues by showing just how important education was in determining Trump/Clinton support:

  • High-education, medium-income white counties shifted to Clinton.
  • High-income, medium-education white counties shifted to Trump.
  • Highly educated majority-minority counties shifted toward Clinton.
  • Low-education majority-minority counties shifted toward Trump.

Silver concludes,

In short, it appears as though educational levels are the critical factor in predicting shifts in the vote between 2012 and 2016. You can come to that conclusion with a relatively simple analysis, like the one I’ve conducted above, or by using fancier methods. In a regression analysis at the county level, for instance, lower-income counties were no more likely to shift to Trump once you control for education levels. And although there’s more work to be done, these conclusions also appear to hold if you examine the data at a more granular level, like by precinct or among individual voters in panel surveys.

So it wasn’t necessarily the economically destitute that voted for Trump. A 2016 Gallup study found

that Americans who live in places where employment in manufacturing has declined since 1990 are not more favorable to Trump. Rothwell [the author] did not find a relationship when he focused only on white respondents, either, or even specifically on white Republicans. Trump’s supporters have many other traits in common with the factory workers whose economic prospects have been negatively affected by automation and global trade. They tend to be less educated men who hold blue-collar occupations. Yet those two broad trends in factory work do not account for Trump’s appeal, Rothwell’s analysis suggests. In fact, among those who share other traits, those who live in districts with more manufacturing are less favorably disposed toward Trump.

However, Silver offers a few “competing hypotheses” to the straightforward interpretation above:

  • Education levels may be a proxy for cultural hegemony. Academia, the news media and the arts and entertainment sectors are increasingly dominated by people with a liberal, multicultural worldview, and jobs in these sectors also almost always require college degrees. Trump’s campaign may have represented a backlash against these cultural elites.[ref]I’m partial to this explanation.[/ref]
  • Educational attainment may be a better indicator of long-term economic well-being than household incomes. Unionized jobs in the auto industry often pay reasonably well even if they don’t require college degrees, for instance, but they’re also potentially at risk of being shipped overseas or automated.
  • Education levels probably have some relationship with racial resentment, although the causality isn’t clear. The act of having attended college itself may be important, insofar as colleges and universities are often more diverse places than students’ hometowns. There’s more research to be done on how exposure to racial minorities affected white voters. For instance, did white voters who live in counties with large Hispanic populations shift toward Clinton or toward Trump?
  • Education levels have strong relationships with media-consumption habits, which may have been instrumental in deciding people’s votes, especially given the overall decline in trust in the news media.
  • Trump’s approach to the campaign — relying on emotional appeals while glossing over policy details — may have resonated more among people with lower education levels as compared with Clinton’s wonkier and more cerebral approach.

So with that, enjoy Inauguration Day.

Are You Really the 99%?

Image result for we are the 99%
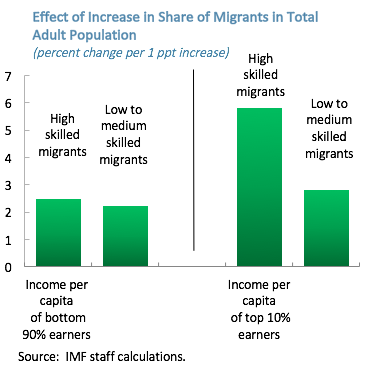
Technically, perhaps, but it’s difficult to feel bad for the top 10-15 percent.

“If you had only $2,220 to your name,” reports The Economist, “(adding together your bank deposits, financial investments and property holdings, and subtracting your debts) you might not think yourself terribly fortunate. But you would be wealthier than half the world’s population, according to this year’s Global Wealth Report by the Crédit Suisse Research Institute. If you had $71,560 or more, you would be in the top tenth. If you were lucky enough to own over $744,400 you could count yourself a member of the global 1% that voters everywhere are rebelling against.”

It turns out that 89% of the world’s assets are owned by the wealthiest top 10 percent:

That lucky tenth now includes over 44m Chinese, about 4.4% of the country’s adult population. A far greater number (almost half of China’s adults) cluster in the next three deciles down. Closer to the bottom of the pyramid, there is a similar bulge of Indians in the second and third deciles (with wealth between $30 and $603). Below them, the bottom tenth is a peculiar mix. It is populated by poor countries, where many people have nothing, and rich ones, where people can own very much less than that. It includes a surprising number of Americans (over 21m), whose debts outweigh their assets. But most Americans are much better off. Over 40% belong to the top tenth of the global wealth distribution (and over 18m belong to the global 1%). Some of those railing against the global elite probably do not know they belong to it. 


Nation Building From the Ground Up

I’ve written on the social science of military intervention before, noting that they rarely achieve the democratic goals of those intervening. A new study distinguishes between top-down and bottom-up approaches to foreign intervention: “Top-down approaches to foreign intervention emphasise gaining citizen compliance by making it costly for citizens to oppose the state, whereas bottom-up approaches aim to increase the benefits of supporting the state by providing public goods, economic aid, and political opportunities.” Drawing on evidence from the Vietnam War, the researchers find (perhaps unsurprisingly),

Image result for vietnam warEstimates document that the bombing of South Vietnamese population centres backfired, leading more Vietnamese to participate in Viet Cong (VC) military and political activities and increasing VC attacks on troops and civilians. The initial deterioration in security entered the next quarter’s security score, increasing the probability of future bombing and hence leading to sustained increases in VC activity. Moreover, while US intervention aimed to build a strong state and engaged civic society that would provide a bulwark against communism after US withdrawal, bombing instead reduced the probability that the local government collected taxes, decreased access to primary schools, and reduced participation in civic organisations. To the extent that spillover effects of bombing on other locations exist, the impacts tend to go in the same direction as the effects on the locations that were bombed.

Interviews of VC prisoners and defectors provide a potential explanation for why bombing increased VC activity. Grievances against the government – particularly in cases where a civilian family member was killed in US or South Vietnamese attacks – were strong motivators for joining the VC (Denton 1968). Civilian casualties and property damage are plausibly particularly harmful to the trust between government and citizens that underlies an effective social contract.

In order to compare the two strategies, the authors explored

the boundary between Military Region I – commanded by the US Marine Corps (USMC) – and Military Region II – commanded by the US Army. The Marines emphasised providing security by embedding soldiers in communities and winning hearts and minds through development programmes (USMC 2009). Their approach was motivated by the view that “in small wars the goal is to gain decisive results with the least application of force… the end aim is the social, economic, and political development of the people” (USMC 1940). In contrast, the Army relied on overwhelming firepower deployed through search and destroy raids (Krepinevich 1986, Long 2016). Evidence points to this difference in counterinsurgency strategies as a central distinction between the Army and Marines.

Hamlets just to the USMC side of the boundary were less likely to have a VC presence than those just to the Army side, and public opinion data document that citizens in the USMC region reported less anti-Americanism and more positive attitudes towards all levels of South Vietnamese government than did citizens in the Army region. Pre-period VC attacks, pre-characteristics, and soldier characteristics – including Armed Forces Qualifying Test scores – are all relatively balanced across the boundary, suggesting that the effects are driven by differences in military strategy and not by omitted factors.

Civility, trust, and community work better than violence. Fancy that.

How Much is $100 Worth in Your State?

The following map provided by the Tax Foundation (based on data from the Bureau of Economic Analysis) “shows the real value of $100 in each state. Prices for the same goods are often much cheaper in states like Missouri or Ohio than they are in states like New York or California. As a result, the same amount of cash can buy you comparatively more in a low-price state than in a high-price state…Using [BEA] data, we have adjusted the value of $100 to show how much it buys you in each state.”

Economist Alan Cole summarizes,

The states where $100 is worth the most are Mississippi ($115.34), Arkansas ($114.29), Alabama ($113.90), South Dakota ($113.64), and West Virginia ($112.49). In contrast, $100 is effectively worth the least in the District of Columbia ($84.67), Hawaii ($85.62), New York ($86.43), New Jersey ($87.34), and California ($88.97)…Regional price differences are strikingly large; real purchasing power is 36 percent greater in Mississippi than it is in the District of Columbia. In other words, by this measure, if you have $50,000 in after-tax income in Mississippi, you would have to have after-tax earnings of $68,000 in the District of Columbia just to afford the same overall standard of living.

Case in point, when adjusted for purchasing power, Nebraskan real income exceeds that of Californians:

Cole concludes,

Many policies – like minimum wage, public benefits, and tax brackets – are denominated in dollars. But with different price levels in each state, the amounts aren’t equivalent in purchasing power. This has some unexpected consequences; people in high price-level states like New Jersey will often pay more in federal taxes without feeling particularly rich.

AEA Meeting: Minimum Wage Research

The New York Times has a recent article discussing new research on the minimum wage presented at the annual meeting of the American Economic Association:

Image result for minimum wageJohn Horton of New York University conducted an experiment on an online platform where employers post discrete jobs — including customer service support, data entry, and graphic design — and workers submit a proposed hourly wage for completing them.

…At first glance, the findings were consistent with the growing body of work on the minimum wage: While the workers saw their wages rise, there was little decline in hiring. But other results suggested that the minimum wage was having large effects. Most important, the hours a given worker spent on a given job fell substantially for jobs that typically pay a low wage — say, answering customer emails.

Mr. Horton concluded that when forced to pay more in wages, many employers were hiring more productive workers, so that the overall amount they spent on each job changed far less than the minimum-wage increase would have suggested…When the minimum wage increased, employers tended to hire workers who had earned higher wages in the past, suggesting that they were looking for a more productive work force. 

If the pattern Mr. Horton identified were to apply across the economy, it would raise questions about whether increasing the minimum wage is as helpful to those near the bottom of the income spectrum as some proponents assume. The higher minimum wage could cost low-skilled workers their jobs, as employers rush to replace them with somewhat more skilled workers.

Another study found that when the minimum wage increases, employers may be put out of business. After identifying the ratings of thousands of restaurants in the San Francisco area, the researchers

found that many poorly rated restaurants tend to go out of business after a minimum-wage increase takes effect. By contrast, highly rated restaurants appear to be largely unaffected by minimum-wage increases, and over all, there is no substantial rise in restaurant closings after a minimum-wage increase. 

The results are broadly consistent with a 2013 study…showing that a sizable minimum-wage increase in New Jersey resulted in many lost jobs as numerous businesses closed, but an almost offsetting number of new jobs as other businesses opened, which the authors argue were more productive. 

Just add this to the growing evidence of adverse effects of the minimum wage.

Why We Work: TED Talk by Barry Schwartz

This is part of the DR Book Collection.

Image result for why we workAs some of my past writing should indicate, the concept of meaningful work is a major area of interest for me. What management researchers have found is the prevalence of both intrinsic and prosocial motivation when it comes to constructing meaning at work. As Wharton professor Adam Grant explains, “[P]sychologists have demonstrated that prosocial and intrinsic motivations involve different reasons for expending effort. For intrinsically motivated individuals, effort is based on interest and enjoyment; for prosocially motivated individuals, effort is based on a desire to benefit others.”[ref]Adam M. Grant, “Does Intrinsic Motivation Fuel the Prosocial Fire? Motivational Synergy in Predicting Persistence, Performance, and Productivity,” Journal of Applied Psychology 93:1 (2008): 49.[/ref] Psychologist Barry Schwartz highlights this kind of research in his short TED book Why We Work. For example, Schwartz explores the impact of “job crafting” and viewing one’s job as a “calling”:

It is people who see their work as a “calling” who find it most satisfying. For them, work is one of the most important parts of life, they are pleased to be doing it, it is a vital part of their identity, they believe their work makes the world a better place, and they would encourage their friends and children to do this kind of work. People whose work is a calling get great satisfaction from what they do (pg. 17).

This outlook is not necessarily brought about by the job description provided by the company, but often through aligning one’s values and job performance with the ultimate purpose (the Aristotelian telos) of the organization. It is especially motivating to be in contact with those who are positively affected by your work. While I at times quibbled with his economic reasoning (or the absence thereof), I was pleased to see Schwartz acknowledge the “positive-sum structure” of market transactions in which everyone benefits:

What this market logic means is that virtually every job that people do can be seen as improving the lives of customers, even if only in small ways. And what that means is that virtually every job that people do can be made meaningful by focusing on the way sin which it improves the lives of customers, as long as it’d done right and done well (pg. 30).

For those unfamiliar with the research behind meaningful work, this book can serve has a nice introduction. You can see Schwartz’s TED talk below.

Why Therapy Works: Interview with Louis Cozolino

This is part of the DR Book Collection.

Image result for why therapy worksI don’t think I’ve ever mentioned this before on here, but, as some of  you may have guessed, I go to therapy. I haven’t as of late for various reasons, but for a solid two years I went pretty much every other week. My interest in shame and vulnerability has been largely due to my personal work in therapy. This is why as soon as I heard of psychologist Louis Cozolino’s book Why Therapy Works: Using Our Minds to Change Our Brains, I immediately picked it up. Granted, like most of my books, it sat dormant for quite a while until I finally finished it up toward the end of last year.

Cozolino walks the reader through the findings of cognitive neuroscience, discussing the “fast” (i.e., “primitive systems, which are nonverbal and inaccessible to conscious reflection, [that] are referred to as implicit memory, the unconscious, or somatic memory”, pg. 5) and “slow” (i.e., “conscious awareness…[which] eventually gave rise to narratives, imagination, and abstract thought”, pg. 5) systems of the brain. Because of this “fast” system, we often have negative internalizations that we’re not even consciously aware of. This is what Cozolino calls “core shame”:

Core shame needs to be differentiated from appropriate shame and guilt that emerge later in childhood. Appropriate shame is an adaptation to social behavior required by the group. Core shame, on the other hand, is an instinctual judgment about the self, and it results in a sense of worthlessness, a fear of being found out, and a desperate striving for perfection. In essence, core shame is tied to our primitive instinct to be a worthy part of the tribe; it is a failure to internalize a deep sense of bonded belonging. As a result, people with core shame feel damaged, unlovable, and abandoned. Thus, core shame becomes a central factor in the perpetuation of insecure attachment and social status schema (pg. 10).

The brain, according to Cozolino, “is a social organ” and “we can leverage the power of human relationships to regulate anxiety and stimulate learning” (pg. xxii). This makes the relational nature of therapy all the more important and effective:

The reasons for our struggles often remain buried in networks of implicit memory, inaccessible to conscious reflection. Psychotherapy guides us in a safe exploration of our early experiences and helps us create a narrative that associates these early experiences with the ways in which our brains and minds distort our current lives. In the process, our symptoms come to be understood as forms of implicit memory instead of insanity, character pathology, or plain stupidity. This process can open the door to greater compassion for oneself, openness to others, and the possibility for healing (pg.9).

The book is comprehensive and excellent for both laypersons and scholars. You can see short interview clips with Cozolino below.